1.0 SONAR Software Design
Software design specifications for SONAR (SIEM-Oriented Neural Anomaly Recognition) subsystem.
1.1 SONAR class structure and relationships SWD-022
Class diagram overview
The SONAR subsystem employs a modular class structure organized around configuration management, data access, and processing pipelines.
Core configuration classes

Scenario management classes

Configuration dataclasses summary
Implementation: sonar/config.py
| Dataclass | Key Fields | Purpose | ------ |
|---|---|---|---|
PipelineConfig |
wazuh, mvad, features, debug, shipping | Top-level pipeline configuration | |
WazuhIndexerConfig |
base_url, username, password, alerts_index_pattern | Wazuh Indexer connection | |
MVADConfig |
sliding_window, device, extra_params | MVAD engine parameters | |
FeatureConfig |
numeric_fields, bucket_minutes, categorical_top_k | Feature extraction configuration | |
DebugConfig |
enabled, data_dir, training_file, detection_file | Debug mode data sources | |
ShippingConfig |
enabled, scenario_id, indexer_url, index_name | Anomaly shipping configuration | |
UseCase |
name, description, training, detection, shipping | Scenario definition | |
TrainingScenario |
lookback_hours, numeric_fields, sliding_window | Training parameters | |
DetectionScenario |
mode, lookback_minutes, threshold, min_consecutive | Detection parameters |
Design patterns
| Pattern | Application | Benefit | ------ |
|---|---|---|---|
| Dataclasses | Configuration objects | Type safety, immutability, validation | |
| Factory Method | UseCase.from_yaml() |
Encapsulates YAML parsing logic | |
| Strategy | Data providers (Wazuh/Local) | Interchangeable data sources | |
| Facade | Engine wrapper | Simplifies MVAD library interface |
Related documentation
- Complete class diagram: docs/manual/sonar_docs/uml-diagrams.md
- Architecture guide: docs/manual/sonar_docs/architecture.md
Parent links: LARC-019 SONAR training pipeline sequence, LARC-020 SONAR detection pipeline sequence
1.2 SONAR feature engineering design SWD-023
Feature extraction module
Implementation: sonar/features.py
The feature engineering module transforms raw Wazuh alerts into time-series data suitable for multivariate anomaly detection.
Time-series bucketing algorithm
Algorithm:
- Parse timestamps from alerts
- Round timestamps to bucket boundaries (configurable interval)
- Group by bucket timestamp
- Aggregate numeric features within each bucket
- Return time-indexed DataFrame
Feature types
| Feature Type | Extraction Method | Example Fields |
|---|---|---|
| Numeric | Direct field extraction | rule.level, data.win.eventdata.processId |
| Categorical | Top-K encoding | agent.name, rule.id, data.srcip |
| Aggregated | Count/sum per bucket | Alert count, unique IPs |
| Derived | Computed features | Time-of-day, day-of-week |
Bucketing strategy
Raw Alerts (variable frequency)
    ↓
Time Buckets (fixed intervals: 1, 5, or 10 minutes)
    ↓
Aggregated Features (one row per bucket)
    ↓
Time-Series DataFrame (input to MVAD)
Example bucketing: - Bucket size: 5 minutes - Input: 1000 alerts over 1 hour - Output: 12 rows (one per 5-minute bucket)
Missing data handling
| Scenario | Strategy |
|---|---|
| Empty bucket | Fill with zeros or forward-fill previous value |
| Missing field | Use default value or skip feature |
| Sparse data | Interpolate or flag as anomalous |
Categorical encoding
Top-K frequency encoding:
- Count occurrences of each categorical value
- Keep top K most frequent values
- Map others to "other" category
- One-hot encode or label encode
Related documentation
- Feature configuration: docs/manual/sonar_docs/scenario-guide.md
- Architecture: docs/manual/sonar_docs/architecture.md
- Implementation: sonar/features.py
Parent links: LARC-019 SONAR training pipeline sequence, LARC-020 SONAR detection pipeline sequence
1.3 SONAR data shipping design SWD-024
Shipper module architecture
The shipper module (sonar/shipper/) manages the indexing of anomaly detection results to Wazuh data streams.
Component structure
sonar/shipper/
├── __init__.py
├── opensearch_shipper.py       # Main shipper class
├── template_manager.py         # Index template installation
└── bulk_processor.py           # Bulk API operations
Data stream strategy
SONAR uses OpenSearch data streams for time-series storage:
| Data Stream | Purpose | Retention |
|---|---|---|
logs-sonar.anomalies-default |
Anomaly events | 30 days |
logs-sonar.scores-default |
Raw anomaly scores | 7 days |
logs-sonar.metrics-default |
Training/detection metrics | 90 days |
Bulk indexing design
class OpenSearchShipper:
    def ship_anomalies(self, documents: List[dict]) -> BulkResult:
        """
        Ships anomaly documents using bulk API.

        Process:
        1. Validate document structure
        2. Add @timestamp and data_stream fields
        3. Batch into chunks (500 documents/batch)
        4. Execute bulk API request
        5. Handle partial failures
        6. Return success/failure counts
        """
Document format
Each anomaly document includes:
{
  "@timestamp": "2026-02-04T12:00:00Z",
  "event": {
    "kind": "alert",
    "category": ["intrusion_detection"],
    "type": ["info"]
  },
  "sonar": {
    "scenario_id": "baseline_scenario",
    "model_name": "baseline_model_20260204",
    "anomaly_score": 0.92,
    "threshold": 0.85,
    "window_start": "2026-02-04T11:55:00Z",
    "window_end": "2026-02-04T12:00:00Z"
  },
  "tags": ["sonar", "anomaly"]
}
Error handling
| Error Type | Strategy | Recovery |
|---|---|---|
| Connection failure | Retry with exponential backoff | Queue for later |
| Document rejection | Log invalid docs | Continue with valid docs |
| Bulk partial failure | Retry failed documents | Track success rate |
| Template missing | Auto-install templates | Retry operation |
Integration with pipeline
The shipper is invoked from pipeline.py after post-processing:
Anomaly Detection → Post-Processing → Shipper → Data Streams
Related documentation
- Data shipping guide:
docs/manual/sonar_docs/data-shipping-guide.md
Parent links: LARC-019 SONAR training pipeline sequence, LARC-020 SONAR detection pipeline sequence
1.4 SONAR debug mode design SWD-025
Local data provider architecture
The debug mode enables offline testing and development without requiring a live Wazuh Indexer instance.
Interface compatibility
The LocalDataProvider implements the same interface as WazuhIndexerClient for transparent dependency injection:
Interface contract:
- Method:
fetch_alerts(start_time, end_time, filters=None) -> list[dict] - Returns: List of alert dictionaries matching time range
- Time filtering: Alerts filtered by
@timestampfield within[start_time, end_time] - Format handling: Supports JSON array, single object, and OpenSearch API response formats
Data source configuration
Debug mode is configured in scenario YAML:
debug:
  enabled: true
  data_dir: "./sonar/test_data/synthetic_alerts"
  training_data_file: "normal_baseline.json"
  detection_data_file: "with_anomalies.json"
JSON data formats supported
The provider handles multiple JSON formats:
-
JSON array (preferred):
json [{"@timestamp": "...", "rule": {...}}, ...] -
Single object:
json {"@timestamp": "...", "rule": {...}} -
OpenSearch API response:
json
   {"hits": {"hits": [{"_source": {...}}, ...]}}
Time filtering
Local data provider applies the same time filtering as Wazuh client:
- Parse
@timestampfrom each alert - Filter alerts within
[start_time, end_time] - Return filtered list
Test data structure
Test data files in sonar/test_data/synthetic_alerts/:
| File | Alerts | Purpose | Anomalies |
|---|---|---|---|
normal_baseline.json |
12,000 | Training data | None |
with_anomalies.json |
6,000 | Detection testing | Yes (injected) |
Dependency injection pattern
The CLI selects the appropriate provider based on debug configuration:
Selection logic:
- If
debug.enabled = truein scenario: instantiateLocalDataProviderwith debug config - Otherwise: instantiate
WazuhIndexerClientwith Wazuh config - Both providers expose identical interface for transparent substitution
Benefits
- No infrastructure: Test without Wazuh deployment
- Reproducibility: Consistent test data across runs
- Speed: No network latency
- Isolation: Test feature changes independently
Implementation reference
Primary implementation: sonar/local_data_provider.py
Related documentation:
- Debug mode guide:
docs/manual/sonar_docs/setup-guide.md - Data injection:
docs/manual/sonar_docs/data-injection-guide.md
Parent links: LARC-019 SONAR training pipeline sequence, LARC-020 SONAR detection pipeline sequence
2.0 RADAR Software Design
Software design specifications for RADAR subsystem.
2.1 RATF: ingestion phase SWD-018
Sequence diagram of data ingestion and user setup in RATF
The diagram below depicts the sequence of actions orchestrated by the RADAR Automated Test Framework in ingestion phase, which - bulk ingests the corresponding dataset into Opensearch index. - and for Suspicious Login scenario creates users in Single Sign-On system.

Parent links: LARC-015 RADAR scenario setup flow
2.2 RATF: setup phase SWD-019
Sequence diagram of environment setup in RATF
The diagram below depicts the sequence of actions orchestrated by the RADAR Automated Test Framework in setup phase, which - sets up Docker environments by copying rules, active responses and setting needed permissions.

Parent links: LARC-015 RADAR scenario setup flow, LARC-016 RADAR active response flow
2.3 RATF: simulation phase SWD-020
Sequence diagram of threat simulation in RATF
The diagram below depicts the sequence of actions orchestrated by the RADAR Automated Test Framework in simulation phase, which - simulates the threat scenario in corresponding agent - feeds the resulted log to corresponding index in Opensearch.

Parent links: LARC-016 RADAR active response flow
2.4 RATF: evaluation phase SWD-021
Sequence diagram of metrics evaluation in RATF
The diagram below depicts the sequence of actions orchestrated by the RADAR Automated Test Framework in evaluation phase, which - retrieves the events from corresponding index to scenario - calculates evaluation metrics by comparing with the dataset and simulation results.

Parent links: LARC-016 RADAR active response flow
2.5 RADAR risk engine implementation design SWD-026
This document specifies the implementation design for RADAR's risk-aware decision engine, which combines anomaly detection, signature-based detection, and cyber threat intelligence into a unified risk score that drives tiered automated responses.
Mathematical specification
Risk formula
The normalized risk score R ∈ [0,1] is computed as:
$$R = w_A \cdot A + w_S \cdot S + w_T \cdot T$$
Subject to the normalization constraint: $w_A + w_S + w_T = 1$
Component calculations
Anomaly intensity (A): $$A = G \times C$$
Where:
- G: Anomaly grade from detector (OpenSearch RCF or SONAR MVAD) $\in [0,1]$
- C: Confidence score from detector $\in [0,1]$
Signature risk (S): $$S = L \times I$$
Where:
- L: Likelihood value for scenario from configuration $\in [0,1]$
- I: Impact value for scenario from configuration $\in [0,1]$
CTI score (T):
$$T = 1 - \prod_{i=1}^{n} (1 - w_i)$$
Where $\omega_i$ is the weight for the i-th CTI indicator flag. This formula ensures:
- T = 0 when no CTI hits
- T approaches 1 as more indicators activate
- Non-linear growth reflects cumulative evidence strength
Default weight configuration
Default weights (overridable in ar.yaml):
DEFAULT_WEIGHTS = {
    'w_ad': 0.4,   # Behavioral detection: high information value
    'w_sig': 0.4,  # Signature detection: high precision
    'w_cti': 0.2   # Threat intelligence: confirmatory evidence
}
Rationale:
- Behavioral and signature detection equally weighted as primary detection methods
- CTI provides confirmatory evidence, reducing false positives
- Weights sum to 1.0 for normalized output
Algorithm specification
Risk calculation algorithm
Input parameters:
anomaly_grade: AD output grade $\in [0,1]$confidence: AD output confidence $\in [0,1]$likelihood: Scenario likelihood $\in [0,1]$impact: Scenario impact $\in [0,1]$cti_indicators: List of (indicator_name, weight) tuplesweights: Dict with keys $\omega_{ad}, \omega_{sig}, \omega_{cti}$
Algorithm:
- Calculate component A: $A = \text{anomaly_grade} \times \text{confidence}$
- Calculate component S: $S = \text{likelihood} \times \text{impact}$
- Calculate component T using CTI product formula:
- Initialize $T = 1.0$
- For each indicator weight $w_i$: $T = T \times (1 - w_i)$
- Final: $T = 1 - T$
- Compute weighted risk: $R = w_{\text{ad}} \times A + w_{\text{sig}} \times S + w_{\text{cti}} \times T$
- Clamp to bounds: $R = \max(0, \min(1, R))$
Returns: Risk score R ∈ [0,1]
Tier determination algorithm
Inputs:
risk_score: Calculated risk $R \in [0,1]$thresholds: Dict with keys 'low' (default: 0.33) and 'high' (default: 0.66)
Mapping logic:
- If $R < \text{threshold}_{\text{low}}$: Tier = "low"
- Else if $R < \text{threshold}_{\text{high}}$: Tier = "medium"
- Else: Tier = "high"
Returns: Tier string ("low", "medium", or "high")
Configuration schema (ar.yaml)
# Scenario-specific configurations
scenarios:
  geoip_detection:
    ad:
      rule_ids: []
    signature:
      rule_ids: ["100900", "100901"]
    w_ad: 0.0
    w_sig: 0.6
    w_cti: 0.4
    delta_signature_minutes: 1
    signature_impact: 0.6
    signature_likelihood: 0.8
    tiers:
      tier1_min: 0.0
      tier1_max: 0.33
      tier2_max: 0.66
    allow_mitigation: true
    mitigations_tier2:
      - firewall-drop
    mitigations_tier3:
      - firewall-drop

  log_volume:
    ad:
      rule_ids: ["100309"]
    signature:
      rule_ids: []
    w_ad: 0.9
    w_sig: 0.0
    w_cti: 0.1
    delta_ad_minutes: 10
    signature_impact: 0.0
    signature_likelihood: 0.0
    tiers:
      tier1_min: 0.0
      tier1_max: 0.33
      tier2_max: 0.66
    allow_mitigation: true
    mitigations_tier2: []
    mitigations_tier3:
      - terminate_service.sh
Implementation classes
RiskEngine class
from dataclasses import dataclass
from typing import Optional

@dataclass
class RiskInput:
    """Input data for risk calculation."""
    anomaly_grade: float = 0.0
    confidence: float = 0.0
    likelihood: float
    impact: float
    cti_indicators: list[tuple[str, float]]

@dataclass
class RiskOutput:
    """Risk calculation result."""
    risk_score: float
    tier: int                    # 0, 1, 2, or 3
    components: dict[str, float] # A, S, T values for transparency

class RiskEngine:
    """Risk calculation engine."""

    def __init__(self, config: dict):
        """
        Initialize risk engine with configuration.

        Args:
            config: Risk parameters from ar.yaml
        """
        self.weights = config.get('weights', DEFAULT_WEIGHTS)
        self.tier_thresholds = config.get('tier_thresholds', DEFAULT_THRESHOLDS)

        # Validate weights sum to 1.0
        weight_sum = sum(self.weights.values())
        if not np.isclose(weight_sum, 1.0):
            raise ValueError(f"Weights must sum to 1.0, got {weight_sum}")

    def calculate(self, input_data: RiskInput) -> RiskOutput:
        """Calculate risk score and tier."""
        # Calculate components
        A = input_data.anomaly_grade * input_data.confidence
        S = input_data.likelihood * input_data.impact
        T = self._calculate_cti_score(input_data.cti_indicators)

        # Weighted combination
        R = (self.weights['w_ad'] * A +
             self.weights['w_sig'] * S +
             self.weights['w_cti'] * T)

        # Determine tier
        tier = self._determine_tier(R)

        return RiskOutput(
            risk_score=R,
            tier=tier,
            components={'A': A, 'S': S, 'T': T}
        )

    def _calculate_cti_score(self, indicators: list[tuple[str, float]]) -> float:
        """Calculate CTI score using product formula."""
        if not indicators:
            return 0.0

        product = 1.0
        for _, weight in indicators:
            product *= (1.0 - weight)

        return 1.0 - product

    def _determine_tier(self, risk_score: float) -> int:
        """Map risk score to tier (0, 1, 2, or 3)."""
        if risk_score < self.tier_thresholds['tier1_min']:
            return 0
        elif risk_score < self.tier_thresholds['tier1_max']:
            return 1
        elif risk_score < self.tier_thresholds['tier2_max']:
            return 2
        else:
            return 3
Testing requirements
Unit test coverage
Test cases must cover:
- Boundary conditions: R = 0, R = 1, tier thresholds
- Weight validation: Sum to 1.0, individual bounds $[0,1]$
- CTI aggregation: Empty list, single indicator, multiple indicators
- Tier mapping: Each tier range, threshold boundaries
- Component isolation: Each of A, S, T independently
Example test case specification
Test: Medium tier risk calculation
Given:
- Weights: $\omega_{ad}=0.4, \omega_{sig}=0.4, \omega_{cti}=0.2$
- Tier thresholds: tier1_min=0.0, tier1_max=0.33, tier2_max=0.66
- Inputs: anomaly_grade=0.62, confidence=0.74, likelihood=0.4, impact=0.9
- CTI indicators: [("ip_blacklisted", 0.6), ("domain_malicious", 0.4)]
Expected:
- Component A = 0.4588
- Component S = 0.36
- Component T = 0.76
- Risk score R = 0.4795 (within [0.47, 0.48])
- Tier = 2
Integration points
- Input: Alert data from Wazuh (via stdin JSON)
- Configuration: ar.yaml loaded at active response initialization
- Output: Risk score and tier logged to active-responses.log
- Action planning: Tier drives action selection in radar_ar.py
Performance requirements
- Algorithmic complexity: O(n) where n = number of CTI indicators (typically < 10)
- No external API calls during calculation (CTI queried earlier in pipeline)
- Target execution time: < 10ms (suitable for synchronous active response)
Implementation references
Primary implementation: radar/scenarios/active_responses/radar_ar.py
Configuration files:
- radar/scenarios/active_responses/ar.yaml
- Example scenarios: radar/scenarios/
Related documentation:
- Risk calculation math: docs/manual/radar_docs/radar-risk-math.md
Parent links: LARC-021 RADAR risk engine calculation flow, LARC-026 RADAR active response decision pipeline
2.6 RADAR active response script design SWD-027
This document specifies the software design for radar_ar.py, the main active response script that orchestrates risk-aware automated threat response in RADAR.
Architecture overview
The script implements a pipeline architecture with pluggable scenario strategies, following these design patterns:
- Strategy Pattern: Scenario-specific behavior via BaseScenario subclasses
- Registry Pattern: Scenario identification via configured rule mappings
- Pipeline Pattern: Sequential stages with error handling at each step
- Data Classes: Type-safe configuration and data structures
Class structure
RadarActiveResponse (main orchestrator)
class RadarActiveResponse:
    """Main orchestrator for RADAR active response pipeline."""

    def __init__(self, config_path: str = "/var/ossec/active-response/ar.yaml"):
        """
        Initialize active response system.

        Args:
            config_path: Path to ar.yaml configuration file

        Behavior:
            - Loads configuration from ar.yaml
            - Initializes ScenarioIdentifier with rule mappings
            - Creates API clients from environment variables:
              * WazuhApiClient (WAZUH_API_URL, WAZUH_AUTH_USER, WAZUH_AUTH_PASS)
              * OpenSearchClient (OS_URL, OS_USER, OS_PASS, OS_VERIFY_SSL)
              * DecipherClient (optional: DECIPHER_BASE_URL, DECIPHER_VERIFY_SSL)
            - Sets up logger for audit trail
            - Initializes decision cache for idempotency
        """
        pass

    def run(self) -> int:
        """
        Execute the complete active response pipeline.

        Returns:
            Exit code: 0 (success), 1 (no match), 2 (error)

        Pipeline Stages:
            1. Read alert from stdin (JSON format)
            2. Identify scenario via rule ID mapping
            3. Check idempotency (SHA256 hash of alert_id:timestamp:scenario)
            4. Get scenario-specific handler (BaseScenario subclass)
            5. Collect context (OpenSearch query for correlated events)
            6. CTI enrichment (query SATRAP DECIPHER for IOC reputation)
            7. Calculate risk score (weighted formula based on detection type)
            8. Plan actions (tier-based selection from ar.yaml)
            9. Execute actions (Wazuh AR, email, case creation)
            10. Audit log (structured JSON to active-responses.log)

        Error Handling:
            - Returns 1 if no alert or no scenario match
            - Returns 0 if duplicate decision (idempotency check)
            - Returns 2 on critical error (logged with stack trace)
        """
        pass

    def _read_alert_from_stdin(self) -> dict | None:
        """Read and parse Wazuh alert from stdin. Returns None on empty input or JSON parse error."""
        pass

    def _generate_decision_id(self, alert: dict, scenario_name: str) -> str:
        """
        Generate unique decision ID for idempotency.

        Formula: SHA256(alert_id:timestamp:scenario_name)[:16]
        """
        pass

    def _collect_context(
        self,
        alert: dict,
        scenario: 'BaseScenario',
        scenario_context: dict
    ) -> dict:
        """
        Query OpenSearch for correlated events and extract IOCs.

        Behavior:
            1. Get time window from scenario handler (scenario.get_time_window)
            2. Get effective agent filter (scenario.get_effective_agent)
            3. Build OpenSearch query with time range and agent filter
            4. Execute query on wazuh-alerts-* index
            5. Extract IOCs from alert + correlated events

        Returns:
            dict with keys: window_start, window_end, effective_agent,
                           correlated_events, iocs
        """
        pass

    def _extract_iocs(self, alert: dict, events: list[dict]) -> dict:
        """
        Extract indicators of compromise from alert and events.

        IOC Categories:
            - ips: srcip, dstip, src_ip, dst_ip fields
            - users: srcuser, dstuser, user, username fields
            - hashes: md5, sha1, sha256 fields
            - domains: url, hostname, domain fields

        Returns:
            dict[str, list[str]] with IOCs grouped by category
        """
        pass
ScenarioIdentifier (registry pattern)
class ScenarioIdentifier:
    """Maps Wazuh rule IDs to RADAR scenarios."""

    def __init__(self, config: dict):
        """
        Initialize scenario identifier with configuration.

        Args:
            config: Parsed ar.yaml configuration

        Behavior:
            Builds reverse mapping from rule IDs to scenario contexts.
            Mapping includes both signature and AD rule IDs.
        """
        pass

    def identify(self, alert: dict) -> dict | None:
        """
        Identify scenario for given alert.

        Args:
            alert: Wazuh alert dictionary

        Returns:
            Scenario context dict with keys: name, detection, config, alert
            Returns None if rule ID has no matching scenario

        Lookup Logic:
            - Extract rule.id from alert
            - Search rule_to_scenario mapping
            - Return scenario context if found
        """
        pass
BaseScenario (strategy pattern)
from abc import ABC, abstractmethod
from typing import Tuple
from datetime import datetime

class BaseScenario(ABC):
    """Base class for scenario-specific behavior."""

    def get_time_window(self, alert: dict, config: dict) -> Tuple[datetime, datetime]:
        """
        Determine time window for context collection.

        Default Logic:
            - Parse alert timestamp (ISO 8601)
            - If AD-based: window = [timestamp - delta_ad_minutes, timestamp]
              (default delta_ad_minutes: 10)
            - If signature-based: window = [timestamp - delta_signature_minutes, timestamp]
              (default delta_signature_minutes: 1)

        Returns:
            (window_start, window_end) as datetime tuple

        Subclasses can override for custom logic.
        """
        pass

    def get_effective_agent(self, alert: dict, scenario_context: dict) -> str | None:
        """
        Determine agent filter for context queries.

        Default Logic:
            - AD-based: return None (query all agents for high-cardinality detection)
            - Signature-based: return alert.agent.name (scope to triggering agent)

        Subclasses can override for scenario-specific filtering.
        """
        pass

    def extract_ad_scores(self, alert: dict) -> Tuple[float, float]:
        """
        Extract anomaly grade and confidence from alert.

        Default Fields:
            - data.anomaly_grade (float)
            - data.confidence (float)

        Returns:
            (grade, confidence) tuple

        Subclasses override for scenario-specific field names.
        """
        pass


class GeoIPScenario(BaseScenario):
    """Scenario handler for GeoIP detection (uses default behavior)."""
    pass


class LogVolumeScenario(BaseScenario):
    """
    Scenario handler for log volume detection.

    Overrides:
        extract_ad_scores(): Handles alternate field names (grade, conf)
    """
    pass
WazuhApiClient
from typing import List, Dict

class WazuhApiClient:
    """Client for Wazuh Manager API interactions."""

    def __init__(self, url: str, user: str, password: str):
        """
        Initialize Wazuh API client.

        Args:
            url: Wazuh Manager API URL
            user: Authentication username
            password: Authentication password
        """
        pass

    def dispatch_active_response(
        self,
        agent_id: str,
        command: str,
        arguments: List[str]
    ) -> Dict:
        """
        Dispatch active response command to agent.

        Args:
            agent_id: Target agent ID (e.g., '001')
            command: Active response command name (e.g., 'firewall-drop')
            arguments: Command arguments (e.g., ['192.168.1.100', 'srcip', '3600'])

        Behavior:
            1. Authenticate if no token cached (POST /security/user/authenticate)
            2. Build payload with command, arguments, alert fields
            3. PUT /active-response with agents_list and wait_for_complete params
            4. Return API response JSON

        Returns:
            API response dict (includes execution status)
        """
        pass
Configuration-driven behavior
All scenario-specific parameters are externalized to ar.yaml:
- Rule ID mappings
- Time window deltas
- Risk calculation weights
- Tier thresholds
- Action enable flags
This allows operational tuning without code changes.
Error handling strategy
- Transient errors: Retry with exponential backoff (OpenSearch, CTI queries)
- Non-critical errors: Log and continue (email send failure doesn't block case creation)
- Critical errors: Abort pipeline, log detailed error, return exit code 2
- All errors: Written to audit log for post-incident analysis
Performance characteristics
- Typical execution time: 100-500ms (depends on CTI query count)
- Memory footprint: < 50MB (mostly alert/event data)
- Suitable for: Synchronous Wazuh active response execution
Integration points
- Input: Wazuh alert JSON via stdin
- Output: Exit code (0/1/2), audit log to
/var/ossec/logs/active-responses.log - External APIs: Wazuh Manager, OpenSearch, SATRAP DECIPHER, SMTP
Data structures
Risk calculation formula
For anomaly detection alerts:
risk_score = (anomaly_grade × w_grade) + (confidence × w_confidence) + (cti_score × w_cti)
For signature-based alerts:
risk_score = (rule_level × w_level) + (cti_score × w_cti)
Weights and tier thresholds defined per scenario in ar.yaml.
Action planning logic
IF tier == 0 THEN
    actions = []
ELSEIF tier == 1 THEN
    actions = [send_email, decipher_incident]
ELSEIF tier == 2 THEN
    actions = [send_email, decipher_incident] + (mitigations_tier2 if allow_mitigation)
ELSE  # tier == 3
    actions = [send_email, decipher_incident] + (mitigations_tier3 if allow_mitigation)
DECIPHER incident creation runs before action planning (in run()), gated on tier >= 1 and health check.
Audit log schema
{
  "timestamp": "ISO8601",
  "decision_id": "SHA256[:16]",
  "scenario": "scenario_name",
  "detection_type": "ad|signature",
  "risk_score": 0.0,
  "tier": 1,
  "actions_planned": ["action1", "action2"],
  "actions_executed": {"action1": {"status": "success|failure", "details": {}}},
  "context": {"window_start": "ISO8601", "window_end": "ISO8601", "event_count": 0},
  "cti": {"iocs_queried": 0, "malicious_count": 0},
  "alert": {"id": "", "rule": {"id": "", "description": ""}}
}
Implementation
This specification describes the design and interfaces for the RADAR active response system. The actual implementation can be found in:
- Main Script: radar/scenarios/active_responses/radar_ar.py
- Configuration: radar/scenarios/active_responses/ar.yaml
- User Documentation: docs/manual/radar_docs/radar-active-response.md
Refer to these files for complete implementation details, including:
- Full method implementations with error handling
- Configuration file structure and examples
- CTI integration logic
- Email templating
- Case management integration
Parent links: LARC-026 RADAR active response decision pipeline
2.7 RADAR detector module design SWD-028
This document specifies the software design for the detector creation module (detector.py), which interfaces with the OpenSearch Anomaly Detection plugin to create and manage RCF-based anomaly detectors.
Module overview
The detector module provides functions to:
- Search for existing detectors by name (idempotent operation)
- Build detector specifications from scenario configurations
- Create detectors via OpenSearch AD API
- Start detectors to begin anomaly analysis
Function specifications
find_detector_id
def find_detector_id(detector_name: str, os_client: OpenSearchClient) -> str | None:
    """Search for existing detector by name in .opendistro-anomaly-detectors index.

    Args:
        detector_name: Detector name (e.g., "log_volume_DETECTOR")
        os_client: OpenSearch client instance

    Returns:
        Detector ID if found, None otherwise
    """
    pass
detector_spec
def detector_spec(scenario_config: Dict, scenario_name: str) -> Dict:
    """Build OpenSearch AD detector specification from scenario configuration.

    Args:
        scenario_config: Scenario configuration from config.yaml
        scenario_name: Name of the scenario

    Returns:
        Detector specification dictionary with required and optional fields
    """
    pass
create_detector
def create_detector(spec: Dict, os_client: OpenSearchClient) -> str:
    """Create anomaly detector via OpenSearch AD plugin API.

    Args:
        spec: Detector specification dictionary
        os_client: OpenSearch client instance

    Returns:
        Detector ID of created detector
    """
    pass
start_detector
def start_detector(detector_id: str, os_client: OpenSearchClient) -> None:
    """Start anomaly detector to begin analysis.

    Args:
        detector_id: ID of detector to start
        os_client: OpenSearch client instance
    """
    pass
Main orchestration
Entry point: main() - Orchestrates detector creation pipeline.
Pipeline stages:
- Validate CLI arguments (requires scenario name)
- Load scenario configuration from config.yaml
- Initialize OpenSearch client from environment variables
- Search for existing detector (idempotent check)
- Create detector if not found
- Start detector
- Output detector ID to stdout
Environment variables: OS_URL, OS_USER, OS_PASS, OS_VERIFY_SSL
Exit codes: 0 (success), 1 (error)
Configuration schema
Scenario configuration parameters used by detector_spec():
Required: features (list of feature definitions with aggregation queries)
Optional: index_prefix, time_field, detector_interval, delay_minutes, categorical_field, shingle_size, result_index
Defaults: time_field="@timestamp", detector_interval=5, delay_minutes=1, shingle_size=8
See radar/config.yaml for complete examples.
OpenSearch AD API endpoints
Detector creation: POST /_plugins/_anomaly_detection/detectors
- Required fields:
name,time_field,indices,feature_attributes,detection_interval - Optional fields:
category_field,shingle_size,result_index,window_delay - Returns:
{"_id": "detector_id", ...}
Detector start: POST /_plugins/_anomaly_detection/detectors/{id}/_start
- No request body
- Returns:
{"_id": "detector_id", ...}on success
See OpenSearch AD plugin documentation for complete API schema.
Error handling
- Detector already exists: find_detector_id returns existing ID, creation skipped
- Invalid configuration: Validation raises ConfigException before API call
- API errors: OpenSearchException raised with error details
- Network errors: Retry with exponential backoff (3 retries, max 10s delay)
Integration
Executed in run-radar.sh pipeline to create and start detector. Outputs detector ID to stdout for use by monitor.py.
Implementation
This specification describes the design and interfaces for the RADAR detector creation module. See these files for complete implementation:
- radar/anomaly_detector/detector.py - Full implementation
- radar/config.yaml - Configuration examples
- docs/manual/radar_docs/radar-run-ad.md - User documentation
- Logging and debugging output
Parent links: LARC-022 RADAR detector creation workflow
2.8 RADAR monitor and webhook module design SWD-029
This document specifies the detailed design of the monitor and webhook Python modules used in RADAR's anomaly detection workflow. These modules create and configure OpenSearch monitors and webhook notification channels.
Module overview
The RADAR anomaly detector subsystem consists of two primary modules:
- webhook.py: Manages OpenSearch notification channel destinations for webhook endpoints
- monitor.py: Creates OpenSearch alerting monitors that evaluate detector results and trigger webhook notifications
webhook.py class structure

Key functions
| Function | Purpose | Returns |
|---|---|---|
notif_list() |
Query all notification configurations | List of notification configs |
notif_find_id(name, url) |
Search for existing webhook by name and URL | Webhook destination ID or None |
notif_create(name, url, description) |
Create new webhook destination | Webhook destination ID |
ensure_webhook(name, url, description) |
Idempotent webhook creation (find or create) | Webhook destination ID |
monitor.py class structure

Monitor creation sequence

Monitor payload structure
The monitor payload includes:
Schedule: Evaluation frequency
- Default: Uses
detector_intervalfrom scenario config - Override:
monitor_intervalif specified - Unit: MINUTES
Search Input: Query against detector result index
- Index pattern:
{result_index}from scenario - Time range: Last N minutes (where N = interval)
- Filter:
detector_idmatches created detector - Aggregation:
max(anomaly_grade)
Trigger Condition (Painless script):
return ctx.results != null &&
       ctx.results.length > 0 &&
       ctx.results[0].aggregations.max_anomaly_grade.value > {grade_threshold} &&
       ctx.results[0].hits.hits[0]._source.confidence > {confidence_threshold}
Webhook Action Message:
{
  "monitor": {"name": "{{ctx.monitor.name}}"},
  "trigger": {"name": "{{ctx.trigger.name}}"},
  "entity": "{{ctx.results.0.hits.hits.0._source.entity.0.value}}",
  "periodStart": "{{ctx.periodStart}}",
  "periodEnd": "{{ctx.periodEnd}}",
  "anomaly_grade": "{{ctx.results.0.hits.hits.0._source.anomaly_grade}}",
  "anomaly_confidence": "{{ctx.results.0.hits.hits.0._source.confidence}}"
}
Configuration parameters
From config.yaml scenario section:
| Parameter | Default | Description |
|---|---|---|
monitor_interval |
detector_interval |
Monitor evaluation frequency (minutes) |
detector_interval |
5 | Detector run interval (minutes) |
anomaly_grade_threshold |
0.2 | Minimum anomaly grade to trigger (0-1) |
confidence_threshold |
0.2 | Minimum confidence to trigger (0-1) |
result_index |
opensearch-ad-plugin-result-{scenario} |
Detector result index pattern |
monitor_name |
{scenario}-monitor |
Monitor name |
trigger_name |
{scenario}-trigger |
Trigger name |
From .env file:
| Variable | Required | Description |
|---|---|---|
OS_URL |
Yes | OpenSearch endpoint URL |
OS_USER |
No | OpenSearch username (if auth enabled) |
OS_PASS |
No | OpenSearch password |
OS_VERIFY_SSL |
No | SSL certificate verification (default: true) |
WEBHOOK_NAME |
No | Webhook destination name (default: "RADAR Webhook") |
WEBHOOK_URL |
Yes | Webhook endpoint URL (e.g., http://manager:8080/notify) |
Error handling
Both modules implement robust error handling:
- Connection errors: HTTP status validation with detailed error messages
- Missing configuration: Explicit validation of required environment variables
- API failures: Graceful exit with status codes and response text
- Idempotency:
find_monitor_id()andnotif_find_id()check for existing resources
Integration with RADAR workflow
run-radar.shexecutesdetector.pyto create OpenSearch AD detector- Detector ID is passed to
monitor.pyas command-line argument monitor.pycallswebhook.ensure_webhook()to get/create notification channelmonitor.pybuilds monitor payload with detector ID and webhook destination ID- Monitor is created and begins evaluating detector results at configured intervals
- When anomalies exceed thresholds, monitor triggers webhook POST to configured endpoint
Parent links: LARC-023 RADAR monitor and webhook workflow
2.9 RADAR helper module class design SWD-030
This document specifies the detailed class design of the RADAR Helper Python daemon that provides real-time log enrichment for geographic and behavioral anomaly detection on Wazuh agents.
Module overview
The RADAR Helper (radar-helper.py) is a multi-threaded Python daemon service that:
- Monitors authentication logs (SSH) and Apache HTTP access logs in real-time
- Enriches log events with geographic metadata (country, region, city, coordinates)
- Calculates behavioral indicators for SSH authentication (geographic velocity, ASN novelty, country changes)
- Writes enriched logs for Wazuh agent ingestion
Class hierarchy

Module-level elements
Constants
| Constant | Value | Description |
|---|---|---|
DEBUG_LOG |
/var/log/radar-helper-debug.log |
Path for the shared debug log file |
Globals
| Name | Type | Description |
|---|---|---|
RADAR_LOG |
RadarLogger |
Module-level singleton providing the shared debug logger and output logger factory |
Helper functions
parse_event_ts()
Parses a timestamp string from a log line header into a Unix epoch float. Supports two formats:
- ISO 8601 (e.g.,
2024-01-15T10:30:00+01:00): parsed viadatetime.fromisoformat() - Syslog (e.g.,
Jan 15 10:30:00): parsed using a regex and current system year
Falls back to time.time() if the string matches neither format.
parse_event_ts(ts_str: str) -> float
This function is used by AuthLogWatcher.handle_line() to ensure that behavioral indicators such as geographic velocity are computed against the actual event time recorded in the log, rather than the processing time.
RadarLogger class
Encapsulates all logger configuration and acts as a factory for output loggers. A module-level singleton (RADAR_LOG) is created at import time.
Attributes
| Attribute | Type | Description |
|---|---|---|
debug_path |
str | Path to the debug log file |
_debug_logger |
logging.Logger | Configured WatchedFileHandler-based debug logger |
Methods
| Method | Parameters | Returns | Description |
|---|---|---|---|
__init__() |
debug_path | - | Initialize and build the debug logger |
_build_debug_logger() |
- | Logger | Create a WatchedFileHandler logger at DEBUG level with timestamp formatting |
build_out_logger() (static) |
name, out_path | Logger | Create an INFO-level WatchedFileHandler logger writing plain messages |
debug (property) |
- | Logger | Returns _debug_logger |
Design notes
build_out_logger() is a static method so that BaseLogWatcher subclasses can call it without needing an instance reference, while still having the logger setup logic centralized in one place. Both _build_debug_logger() and build_out_logger() are idempotent: if a handler for the target path already exists on the logger, a second handler is not added.
BaseLogWatcher class
Abstract base class providing tail-style log monitoring with log rotation handling. Extends threading.Thread.
Attributes
| Attribute | Type | Description |
|---|---|---|
in_path |
str | Input log file path to monitor |
out_path |
str | Output log file path for enriched logs |
logger |
logging.Logger | Output logger, obtained from RadarLogger.build_out_logger() |
debug |
logging.Logger | Debug logger, obtained from radar_logger.debug |
_stop_evt |
threading.Event | Thread stop signal |
Constructor
__init__(in_path, out_path, logger_name, radar_logger: RadarLogger)
The constructor delegates logger creation to RadarLogger: the output logger is obtained via radar_logger.build_out_logger(logger_name, out_path) and the debug logger via radar_logger.debug.
Methods
| Method | Parameters | Returns | Description |
|---|---|---|---|
stop() |
- | void | Set _stop_evt to signal graceful thread termination |
tail_follow() |
- | Iterator[str] | Generator yielding new log lines with inode-based rotation detection |
run() |
- | void | Main thread loop: iterates tail_follow() and calls handle_line() per line |
handle_line() |
line | void | Abstract: process a single log line; must be overridden in subclasses |
Key features
Inode rotation detection:
st = os.stat(self.in_path)
if st.st_ino != ino:
    # File was rotated, reopen
    nf = open(self.in_path, "r")
    f.close()
    f = nf
    ino = os.fstat(f.fileno()).st_ino
Graceful shutdown: The thread runs as a daemon. The stop event allows clean termination and file handles are closed on exit.
AuthLogWatcher class
Concrete implementation monitoring SSH authentication logs with geographic enrichment.
Class attributes
| Attribute | Type | Description |
|---|---|---|
AUTH_LOG |
str | /var/log/auth.log — default input log path |
OUT_AUTH_LOG |
str | /var/log/suspicious_login.log — default output log path |
CITY_DB |
str | /usr/share/GeoIP/GeoLite2-City.mmdb |
ASN_DB |
str | /usr/share/GeoIP/GeoLite2-ASN.mmdb |
WIN_90D_SEC |
int | 7,776,000 — ASN history window in seconds (90 days) |
DT_EPS_H |
float | 1e-9 — minimum time delta in hours to prevent division by zero in velocity calculation |
RX_HEAD |
re.Pattern | Compiled regex matching syslog and ISO 8601 log line headers |
RX_ACCEPT |
re.Pattern | Compiled regex matching SSH Accepted authentication lines |
RX_FAILED |
re.Pattern | Compiled regex matching SSH Failed authentication lines |
Instance attributes
| Attribute | Type | Description |
|---|---|---|
city_reader |
maxminddb.Reader | MaxMind GeoLite2-City database reader |
asn_reader |
maxminddb.Reader | MaxMind GeoLite2-ASN database reader |
users |
Dict[str, UserState] | Per-user state tracking (defaultdict) |
Constructor
__init__(radar_logger: RadarLogger, in_path: str = None, out_path: str = None)
in_path and out_path default to AUTH_LOG and OUT_AUTH_LOG class attributes respectively if not provided. Raises SystemExit with a fatal message if either MaxMind database file is missing.
Methods
| Method | Parameters | Returns | Description |
|---|---|---|---|
drop_old() |
us: UserState, now_sec: int | void | Remove ASN history entries older than 90 days and prune asn_set accordingly |
geo_lookup() |
ip: str | Tuple | Query MaxMind DBs for (country, region, city, lat, lon, asn) |
haversine_km() (static) |
lat1, lon1, lat2, lon2 | float | Great-circle distance in km between two coordinates |
classify_outcome() (static) |
msg_part: str | str | Return "success", "failure", or "info" based on message content |
handle_line() |
line: str | void | Parse SSH log, enrich with geo data, write to output |
Parsing logic
Extraction workflow:
- Match log line header with
RX_HEADto extract timestamp, hostname, program (sshd/sudo), and message content - Parse the timestamp field using
parse_event_ts()to obtain the event epoch time - Search message part for authentication patterns using
RX_ACCEPTorRX_FAILED - Extract username, source IP address, and port number
- Classify outcome as
"success","failure", or"info"based on message content
Enrichment calculations
The AuthLogWatcher enriches authentication events with three behavioral indicators:
Geographic velocity (km/h):
$$v_{geo} = \frac{d_{haversine}(\phi_1, \lambda_1, \phi_2, \lambda_2)}{\max(|\Delta t_{hours}|,\; \varepsilon)}$$
where:
- $d_{haversine}$ is the great-circle distance between the previous and current login coordinates
- $\Delta t_{hours}$ is the signed time difference (event timestamps) between logins in hours
- $\varepsilon = 10^{-9}$ hours (DT_EPS_H) guards against division by zero when events are near-simultaneous
Note: Unlike the previous version, velocity is no longer capped at a fixed maximum. The
DT_EPS_Hguard replaces themax(..., 1e-6)approach and theVEL_CAP_KMHconstant has been removed. Time deltas now useparse_event_ts()on the log's recorded timestamp rather thantime.time(), yielding more accurate velocity estimates for replayed or delayed logs.
Country change indicator:
$$I_{country} = \begin{cases} 1 & \text{if } country_{current} \neq country_{previous} \ 0 & \text{otherwise} \end{cases}$$
ASN novelty indicator:
$$I_{asn} = \begin{cases} 1 & \text{if } ASN_{current} \notin ASN_{history} \ 0 & \text{otherwise} \end{cases}$$
where $ASN_{history}$ contains unique ASNs from the last 90 days.
Output format
Enriched log line appended with RADAR fields:
<original_log_line> RADAR outcome='success' asn='15169' asn_placeholder_flag='false'
country='US' region='California' city='San Francisco' geo_velocity_kmh='450.230'
country_change_i='1' asn_novelty_i='0'
ApacheLogWatcher class
Concrete implementation monitoring Apache HTTP access logs with geographic enrichment. Filters private IP addresses and supports multiple Apache log sources.
Class attributes
| Attribute | Type | Description |
|---|---|---|
APACHE_LOGS |
List[str] | Default Apache log paths: /var/log/apache2/access.log, /var/log/apache2/other_vhosts_access.log |
OUT_APACHE_LOG |
str | /var/log/suspicious_login.log — default output log path |
CITY_DB |
str | /usr/share/GeoIP/GeoLite2-City.mmdb |
RX_RSYSLOG |
re.Pattern | Regex matching rsyslog-formatted lines: <weekday> <date> <time> <host> nginx\|apache: <rest> |
RX_DOMAIN_IP |
re.Pattern | Regex for domain-based Apache log format: domain.tld <srcip> ... |
RX_HOST_PORT_IP |
re.Pattern | Regex for host:port format: host:port <srcip> ... |
RX_TWO_IPS |
re.Pattern | Regex for two-IP format: <something> <srcip> ... |
RX_SINGLE_IP |
re.Pattern | Regex for single IP format: <srcip> ... |
RX_IPV6_MAPPED |
re.Pattern | Regex for IPv6-mapped IPv4: ::ffff:<srcip> ... |
PRIVATE_PREFIXES |
Tuple[str, ...] | Private IP address ranges to filter (RFC 1918 and loopback) |
Instance attributes
| Attribute | Type | Description |
|---|---|---|
city_reader |
maxminddb.Reader | MaxMind GeoLite2-City database reader |
Constructor
__init__(radar_logger: RadarLogger, in_path: str = None, out_path: str = None)
If in_path is not provided, APACHE_LOGS list is used (multiple sources). Raises SystemExit with a fatal message if the MaxMind City database file is missing.
Methods
| Method | Parameters | Returns | Description |
|---|---|---|---|
extract_srcip() |
line: str | Tuple[Optional[str], str] | Extract source IP from various Apache log formats; returns (ip, normalized_line) |
geo_lookup() |
ip: str | Tuple | Query MaxMind DB for (country, region, city, lat, lon) |
handle_line() |
line: str | void | Parse Apache log, filter private IPs, enrich with geo data, write to output |
Parsing logic
IP extraction workflow:
- Strip rsyslog prefix if present using
RX_RSYSLOG - Try to extract source IP using a cascade of regex patterns:
- IPv6-mapped IPv4 (
RX_IPV6_MAPPED) - Host:port format (RX_HOST_PORT_IP) - Domain.tld format (RX_DOMAIN_IP) - Two-IP format (RX_TWO_IPS) - Single IP format (RX_SINGLE_IP) - Return the first match or
(None, line)if no pattern matches
Filtering:
- Lines without double-quote (
") orHTTP/string are skipped (not valid Apache combined log format) - Private IP addresses (RFC 1918, loopback, link-local ranges) are filtered and not logged
Output format
Enriched log line appended with RADAR fields:
<original_log_line> RADAR country="US" region="California" city="San Francisco"
lat="37.77" lon="-122.42"
AuditLogWatcher class
Stub implementation for audit log monitoring. Extends BaseLogWatcher.
Class attributes
| Attribute | Type | Description |
|---|---|---|
AUDIT_LOG |
str | /var/log/audit/audit.log — default input log path |
OUT_AUDIT_LOG |
str | /var/log/audit_volume.log — default output log path |
Constructor
__init__(radar_logger: RadarLogger, in_path: str = None, out_path: str = None)
Defaults in_path and out_path to class attributes.
Methods
| Method | Parameters | Returns | Description |
|---|---|---|---|
handle_line() |
line: str | void | No-op stub; audit log processing not yet implemented |
Note:
AuditLogWatcheris defined for future use. The currentmain()function instantiatesAuthLogWatcherand oneApacheLogWatcherper log path inApacheLogWatcher.APACHE_LOGS.
UserState class
Lightweight state container tracking per-user authentication history.
Attributes (slots)
| Attribute | Type | Description |
|---|---|---|
last_ts |
Optional[float] | Timestamp of last login (Unix epoch seconds, from parse_event_ts()) |
last_lat |
Optional[float] | Latitude of last login location |
last_lon |
Optional[float] | Longitude of last login location |
last_country |
Optional[str] | ISO 3166-1 alpha-2 country code of last login |
asn_hist |
deque[Tuple[str, int]] | ASN history with timestamps (90-day window) |
asn_set |
Set[str] | Set of unique ASNs seen in last 90 days |
Usage pattern
UserState instances are automatically created per user using defaultdict(UserState). Each authentication event updates the user's state with:
- Current event timestamp (parsed from log line), latitude, longitude, and country code
- New ASN appended to history with the event timestamp as integer seconds
- ASN added to the unique ASN set
History pruning
ASN history entries older than 90 days (WIN_90D_SEC) are pruned to keep memory bounded. When removing old entries, the ASN is also removed from asn_set if no other entries in the remaining history reference it.
Helper functions
haversine_km()
Now a static method of AuthLogWatcher (previously a module-level function). Calculates the great-circle distance between two geographic coordinates using the haversine formula:
$$d = 2R \arcsin\left(\sqrt{\sin^2\left(\frac{\phi_2 - \phi_1}{2}\right) + \cos(\phi_1) \cos(\phi_2) \sin^2\left(\frac{\lambda_2 - \lambda_1}{2}\right)}\right)$$
where: - $R = 6371.0088$ km (Earth's mean radius) - $\phi_1, \phi_2$ are latitudes in radians - $\lambda_1, \lambda_2$ are longitudes in radians
Returns: Distance in kilometers
Sequence diagram: Authentication event processing

Configuration and deployment
Systemd service
The RADAR Helper runs as a systemd service:
Service file: /etc/systemd/system/radar-helper.service
[Unit]
Description=RADAR Helper - Real-time log enrichment service
After=network.target

[Service]
Type=simple
ExecStart=/opt/radar/radar-helper.py
Restart=on-failure
RestartSec=5s
User=root

[Install]
WantedBy=multi-user.target
File paths
| Constant / Attribute | Path | Description |
|---|---|---|
DEBUG_LOG (module) |
/var/log/radar-helper-debug.log |
Shared debug log written by all watchers |
AuthLogWatcher.AUTH_LOG |
/var/log/auth.log |
Input: SSH authentication log |
AuthLogWatcher.OUT_AUTH_LOG |
/var/log/suspicious_login.log |
Output: enriched authentication log |
AuthLogWatcher.CITY_DB |
/usr/share/GeoIP/GeoLite2-City.mmdb |
MaxMind GeoLite2 City database |
AuthLogWatcher.ASN_DB |
/usr/share/GeoIP/GeoLite2-ASN.mmdb |
MaxMind GeoLite2 ASN database |
ApacheLogWatcher.APACHE_LOGS[0] |
/var/log/apache2/access.log |
Input: Apache standard access log |
ApacheLogWatcher.APACHE_LOGS[1] |
/var/log/apache2/other_vhosts_access.log |
Input: Apache other virtual hosts access log |
ApacheLogWatcher.OUT_APACHE_LOG |
/var/log/suspicious_login.log |
Output: enriched Apache log |
ApacheLogWatcher.CITY_DB |
/usr/share/GeoIP/GeoLite2-City.mmdb |
MaxMind GeoLite2 City database |
AuditLogWatcher.AUDIT_LOG |
/var/log/audit/audit.log |
Input: audit log (stub) |
AuditLogWatcher.OUT_AUDIT_LOG |
/var/log/audit_volume.log |
Output: audit log (stub) |
Constants
| Constant | Location | Value | Description |
|---|---|---|---|
WIN_90D_SEC |
AuthLogWatcher (class) |
7,776,000 |
ASN history window (90 days in seconds) |
DT_EPS_H |
AuthLogWatcher (class) |
1e-9 |
Minimum time delta (hours) for velocity calculation |
Error handling
- Missing MaxMind databases: Fatal error with
SystemExit - File not found during rotation: Temporary; retried after 0.2 s
- GeoIP lookup failures: Logged; fields left empty
- Parse failures: Logged; line skipped
- Thread exceptions: Logged with full traceback; thread continues
- ISO 8601 / syslog timestamp parse failures:
parse_event_ts()falls back totime.time()
Main entry point
The main() function orchestrates watcher thread initialization and lifecycle management:
def main():
    auth_watcher = AuthLogWatcher(RADAR_LOG)
    apache_watchers = [
        ApacheLogWatcher(RADAR_LOG, in_path=p)
        for p in ApacheLogWatcher.APACHE_LOGS
    ]

    auth_watcher.start()
    for w in apache_watchers:
        w.start()

    try:
        while True:
            time.sleep(1.0)
    except KeyboardInterrupt:
        pass
    finally:
        auth_watcher.stop()
        for w in apache_watchers:
            w.stop()
        auth_watcher.join(timeout=5.0)
        for w in apache_watchers:
            w.join(timeout=5.0)
Initialization
- Create one
AuthLogWatcherinstance - Create one
ApacheLogWatcherinstance per log path inApacheLogWatcher.APACHE_LOGS - Start all watcher threads in daemon mode
Shutdown sequence
- Catch
KeyboardInterrupt(Ctrl+C) or other termination signal - Call
stop()on all watcher threads to set the stop event - Join all threads with a 5-second timeout per thread
- Exit cleanly
Threading model
main()creates anAuthLogWatcherinstance and multipleApacheLogWatcherinstances (one per Apache log), passing the sharedRADAR_LOGsingleton- Each watcher runs in a separate daemon thread
- Threads monitor logs independently with tail-F semantics
- Graceful shutdown via
stop()and Event signaling - Threads joined with 5-second timeout on exit
Implementation
See radar/radar-helper/radar-helper.py for complete implementation.
Parent links: LARC-025 RADAR helper enrichment pipeline
2.10 RADAR simulation framework software design SWD-039
This document specifies the design of the RADAR scenario simulation framework, covering component structure, dispatch logic, the Ansible playbook, the shared utility library, and all scenario-specific simulation scripts.
Purpose
The simulation generates agent-realistic artefacts for validating RADAR detection scenarios end-to-end. It operates exclusively at the agent level, writing to auth logs or the filesystem, so that all Wazuh decoder, rule, and active response stages are exercised under conditions identical to production.
Module inventory
| Module | Type | Responsibility |
|---|---|---|
simulate-radar.sh |
Bash script | Entry point, argument validation, local/remote dispatch |
simulate.yml |
Ansible playbook | Remote agent copy, execution, and cleanup |
common.py |
Python library | Shared utilities: config loading, log writing, timestamp detection |
suspicious_login.py |
Python script | SSH burst failure + success artefact generation |
geoip_detection.py |
Python script | SSH success artefact from non-whitelisted IP |
log_volume.py |
Python script | Exponential filesystem growth simulation |
config.yaml |
YAML configuration | All scenario parameters, no hardcoded values |
Component structure
simulate-radar.sh
  │
  ├── [local]  config.yaml ──► container_name resolution
  │               │
  │               └──► docker exec ──► container
  │                                      └──► /tmp/ratf-simulate/scenarios/
  │                                              ├── common.py
  │                                              ├── config.yaml
  │                                              └── <scenario>.py
  │
  └── [remote] inventory.yaml ──► Ansible
                                    └──► simulate.yml
                                            └──► SSH agent endpoint
                                                   └──► /tmp/ratf-simulate/scenarios/
                                                           ├── common.py
                                                           ├── config.yaml
                                                           └── <scenario>.py
Sequence diagram

simulate-radar.sh
Responsibilities
- Parse and validate
SCENARIOand--agentarguments - Resolve SSH key for remote mode
- Resolve
container_namefromconfig.yamlfor local mode - Dispatch to
docker exec(local) oransible-playbook(remote)
Argument specification
| Argument | Required | Values | Description |
|---|---|---|---|
SCENARIO |
Yes | suspicious_login, geoip_detection, log_volume |
Scenario to simulate |
--agent |
Yes | local, remote |
Agent execution target |
--ssh-key |
No | Path to SSH private key (default: ~/.ssh/id_ed25519) |
Local dispatch design
1. python3 inline: read config.yaml[SCENARIO].container_name
   └── exit 1 if missing or empty
2. docker exec -i CONTAINER sh -lc "mkdir -p /tmp/ratf-simulate/scenarios"
3. docker cp RATF_SCENARIO_DIR/. CONTAINER:/tmp/ratf-simulate/scenarios/
4. docker exec -i CONTAINER sh -lc
       "python3 /tmp/ratf-simulate/scenarios/SCENARIO.py"
5. exit with docker exec return code
Remote dispatch design
1. Resolve SSH_KEY path; exit 1 if file not found
2. If SSH_AUTH_SOCK unset or ssh-add -l fails:
     eval $(ssh-agent -s); ssh-add SSH_KEY
   else: ssh-add SSH_KEY if fingerprint not already loaded
3. ansible-playbook
     -i inventory.yaml
     --limit wazuh_agents_ssh
     --ask-vault-pass
     roles/wazuh_agent/playbooks/simulate.yml
     -e radar_simulate_scenario=SCENARIO
     -e ratf_scenarios_dir=RATF_SCENARIO_DIR
4. exit with ansible-playbook return code
Error conditions
| Condition | Exit code | Message |
|---|---|---|
| Missing SCENARIO | 1 | Missing scenario argument |
| Invalid SCENARIO | 1 | Invalid scenario: <value> |
| Missing --agent | 1 | Missing --agent <local\|remote> |
| Invalid --agent | 1 | Invalid --agent value: <value> |
| RATF_SCENARIO_DIR missing | 1 | Scenario dir not found: <path> |
| inventory.yaml missing | 1 | Inventory not found: <path> |
| container_name missing | 1 | Missing '<scenario>.container_name' in config.yaml |
| SSH key not found | 1 | SSH key not found at: <path> |
| Playbook missing | 1 | Playbook not found: <path> |
simulate.yml (Ansible playbook)
Responsibilities
- Validate input variables on remote host
- Create working directory
- Copy scenario scripts from controller to agent
- Execute selected scenario script
- Print stdout for audit trail
- Unconditionally clean up working directory
Variable interface
| Variable | Source | Description |
|---|---|---|
radar_simulate_scenario |
-e flag |
Scenario name, validated against allowed list |
ratf_scenarios_dir |
-e flag |
Absolute path to scenarios dir on controller |
remote_workdir |
Playbook default | /tmp/ratf-simulate |
remote_scenarios_dir |
Derived | {{ remote_workdir }}/scenarios |
Task sequence
1. assert:
     radar_simulate_scenario in [suspicious_login, geoip_detection, log_volume]
     ratf_scenarios_dir is defined

2. file: path={{ remote_scenarios_dir }} state=directory mode=0755

3. copy: src={{ ratf_scenarios_dir }}/ dest={{ remote_scenarios_dir }}/ mode=0755

4. command: python3 {{ remote_scenarios_dir }}/{{ radar_simulate_scenario }}.py
   register: sim_run

5. debug: var=sim_run.stdout

6. file: path={{ remote_workdir }} state=absent
   when: true  (unconditional)
Design notes
become: trueis set at play level; all tasks run with privilege escalation.gather_facts: falsereduces overhead on security-sensitive endpoints.- Cleanup in step 6 is synchronous and removes the entire work tree.
For
suspicious_loginandgeoip_detection, auth log entries written to/var/log/auth.logare outside this tree and are not removed. Forlog_volume, the spike file is written totarget_dir(e.g./var/log) and is also outside this tree; it is handled separately by async Python-scheduled cleanup ifcleanup_minutes > 0.
common.py
Responsibilities
- Load
config.yamlfrom the directory co-located with the script - Detect auth log timestamp format (syslog vs ISO 8601)
- Append lines to auth log via
tee(with optional sudo) - Format ISO timestamps with configurable timezone offset
- Parse
.envfiles - Locate repository root by walking up the directory tree
suspicious_login.py
Design
Parameters loaded from config.yaml:
  common.timezone_offset, common.hostname
  suspicious_login.log_path, sudo_tee, user, sshd_pid,
  fail_port, success_port,
  key_fingerprint_fail, key_fingerprint_success,
  ip_pool (list), window_seconds

Algorithm:
  step ← max(1, window_seconds // (len(ip_pool) + 1))
  base ← datetime.now()

  Phase 1 – failure burst:
    for i, ip in enumerate(ip_pool):
      ts  ← base + timedelta(seconds = i × step)
      fmt ← detect_authlog_timestamp_format(ts, tz, auth_path)
      line ← f"{fmt} {host} sshd[{pid}]: Failed password for {user}
               from {ip} port {fail_port} ssh2: {key_fail}"
      append_line_authlog(line, auth_path, sudo_tee)

  Phase 2 – success:
    ts  ← base + timedelta(seconds = min(window-1, len(ip_pool) × step))
    fmt ← detect_authlog_timestamp_format(ts, tz, auth_path)
    line ← f"{fmt} {host} sshd[{pid}]: Accepted publickey for {user}
             from {ip_pool[0]} port {success_port} ssh2: {key_ok}"
    append_line_authlog(line, auth_path, sudo_tee)
Detection targets
- Rules 210012/210013: frequency ≥ 5 failures within 60 s from same source/destination user
- Rules 210020/210021: impossible travel when ip_pool spans multiple countries
Design notes
stepdistributes events evenly acrosswindow_secondsto satisfy thetimeframe="60"frequency="5"constraints in rules 210012/210013.- The default ip_pool contains six geographically diverse addresses (US, Australia, Japan, UAE, Europe), covering the impossible travel detection path simultaneously.
- Auth log entries are not removed by the framework and persist in
/var/log/auth.logafter simulation completes.
geoip_detection.py
Design
Parameters loaded from config.yaml:
  common.timezone_offset, common.hostname
  geoip_detection.log_path, sudo_tee, user, sshd_pid,
  success_port, ip, key_fingerprint_success

Algorithm:
  ts  ← datetime.now()
  fmt ← detect_authlog_timestamp_format(ts, tz, auth_path)
  line ← f"{fmt} {host} sshd[{pid}]: Accepted publickey for {user}
           from {ip} port {success_port} ssh2: {key_ok}"
  append_line_authlog(line, auth_path, sudo_tee)
Detection targets
- Rules 100900/100901:
authentication_successgroup +radar_countrynot in whitelist - Default IP
8.8.8.8resolves to US (Google), outside the Luxembourg/EU Greater Region whitelist
Design notes
- A single log line is sufficient; the RADAR helper enriches it with
radar_countrybefore forwarding to the rule engine. - Auth log entries are not removed by the framework and persist in
/var/log/auth.logafter simulation completes.
log_volume.py
Design
Parameters loaded from config.yaml:
  log_volume.target_dir, spike_filename, steps,
  start_bytes, growth_factor, sleep_seconds,
  max_total_bytes, max_step_bytes, cleanup_minutes

Helper functions:
  _int(v, default)   : safe int cast with fallback
  _float(v, default) : safe float cast with fallback
  _ensure_dir(path)  : mkdir -p equivalent
  _append_bytes(file_path, bytes_to_add, chunk=1MB):
    opens file in append+binary mode, writes in chunk-sized blocks
  _schedule_cleanup(file_path, minutes):
    Popen(["sh", "-lc",
           f"(sleep {s}; rm -f '{fp}') >/dev/null 2>&1 &"])

Main algorithm:
  spike_file ← Path(target_dir) / spike_filename
  _ensure_dir(base_dir)
  spike_file.touch() if not exists
  total_written ← 0

  for i in range(steps):
    desired_add ← int(start_bytes × (growth_factor ^ i))
    add_bytes   ← min(desired_add, max_step_bytes)
    add_bytes   ← min(add_bytes, max_total_bytes - total_written)
    if add_bytes ≤ 0: break
    _append_bytes(spike_file, add_bytes)
    total_written += add_bytes
    time.sleep(sleep_seconds)

  if cleanup_minutes > 0:
    _schedule_cleanup(spike_file, cleanup_minutes)
Detection target
- Log volume metric collector measures
target_dirsize - Growth triggers OpenSearch AD anomaly detector
- Rule 100309 (LogVolume-Growth-Detected) fires via monitor → webhook
Safety constraints
| Parameter | Default | Purpose |
|---|---|---|
max_total_bytes |
9 GB | Prevents runaway total disk consumption |
max_step_bytes |
1.5 GB | Limits single-step growth burst |
cleanup_minutes |
5 | Schedules async spike file removal |
Design notes
- Cleanup is asynchronous (background shell) to avoid blocking the simulation script.
- On the remote Ansible path, Ansible's synchronous cleanup removes
/tmp/ratf-simulatebut does NOT remove the spike file, which is written totarget_diroutside the work directory. Ifcleanup_minutesis 0, the spike file must be removed manually.
config.yaml schema
common:
  timezone_offset: str   # e.g. "+01:00"
  hostname:        str   # agent hostname used in log line host field

suspicious_login:
  log_path:                str        # path to auth.log on agent
  sudo_tee:                bool       # prepend sudo to tee command
  user:                    str        # SSH username in log lines
  sshd_pid:                int        # PID used in sshd log entries
  fail_port:               int        # source port for failure lines
  success_port:            int        # source port for success line
  key_fingerprint_fail:    str        # key field in failure lines
  key_fingerprint_success: str        # key field in success line
  ip_pool:                 list[str]  # IPs used for failure burst
  window_seconds:          int        # total event window (default 60)

geoip_detection:
  log_path:                str
  sudo_tee:                bool
  user:                    str
  sshd_pid:                int
  success_port:            int
  ip:                      str        # single non-whitelisted IP
  key_fingerprint_success: str

log_volume:
  target_dir:      str    # monitored directory (e.g. /var/log)
  spike_filename:  str    # name of generated spike file
  steps:           int    # number of growth steps
  start_bytes:     int    # bytes added in step 0
  growth_factor:   float  # exponential multiplier per step
  sleep_seconds:   float  # delay between steps
  max_total_bytes: int    # safety cap on total written
  max_step_bytes:  int    # safety cap per step
  cleanup_minutes: int    # 0 = no cleanup; >0 = async remove after N min
Parent links: HARC-005 RADAR Automated Test Framework architecture
2.11 RADAR GUI software design SWD-041
This document specifies the software design of the RADAR GUI (radar/gui/), a Flask-based web application providing a browser interface for the full RADAR operational lifecycle. It covers the backend-to-frontend architecture, key design decisions, and the credential/session security model. Frontend component internals (HTML structure, JavaScript event wiring, CSS) are out of scope.
Purpose and scope
The RADAR GUI replaces direct file editing and shell invocation for routine RADAR operations. It wraps build-radar.sh, run-radar.sh, and health-radar.sh with a browser interface, manages ar.yaml and inventory.yaml through structured forms, stores connector credentials in .env, and handles Ansible Vault encryption of sudo passwords through a session-scoped in-memory credential store.
Module structure
gui/
├── app.py                 Flask application: all routes and startup
├── requirements.txt       Runtime dependencies
└── orchestrator/          Backend modules — no Flask dependency
    ├── ar_config.py       Read/write ar.yaml
    ├── inventory.py       Read/write inventory.yaml
    ├── connectors.py      Read/write .env, live connector tests
    ├── deploy.py          Command assembly, subprocess streaming
    ├── health.py          Per-node Ansible health-check execution
    └── vault.py           Ansible Vault wrappers, SSH passphrase session
The orchestrator modules are deliberately kept free of Flask imports. This separation allows the file-management and subprocess logic to be tested independently and reused by CLI tooling without importing the web framework.

Flask application: app.py
Startup and RADAR_ROOT resolution
app.py resolves the RADAR root directory at import time:
RADAR_ROOT = str(Path(os.environ.get("RADAR_ROOT", Path(__file__).parent.parent)).resolve())
The default places the root at the parent of gui/ (i.e., the radar/ directory). Setting the RADAR_ROOT environment variable before starting the server redirects all file I/O to a different installation, enabling the GUI to manage an alternate RADAR root without code changes.
The server runs with threaded=True so that long-running streaming responses (build output, health check output) do not block subsequent requests on the same worker.
Route organisation
Routes are grouped into two sets: page routes and API routes.
Page routes (/, /active-responses, /infrastructure, /connectors, /deploy) render templates with data fetched from the orchestrator modules. They pass only the data needed for initial render; all subsequent interactions go through the API routes via JavaScript.
API routes (/api/...) are the stable contract between the frontend and the backend.
Orchestrator modules
AR configuration management: ar_config.py
Reads and writes scenarios/active_responses/ar.yaml. The central design decision is default-block deep-merge: ar.yaml contains a scenarios.default block that holds baseline values shared across all scenarios. get_scenario() loads the full file, starts with a deep copy of the default block, and merges the scenario-specific block on top. This means scenario entries in ar.yaml only need to store values that differ from the defaults.
update_scenario() applies a partial patch to the existing scenario entry using the same deep-merge logic, so the GUI can send only the changed fields rather than the full config on every save.
All writes use atomic temp-file replacement (ar.yaml.tmp -> ar.yaml) under a module-level threading.Lock to prevent partial writes if two browser sessions submit simultaneously.
Ansible inventory management: inventory.py
Reads and writes inventory.yaml using the four Ansible host groups: wazuh_manager_local, wazuh_manager_ssh, wazuh_agents_container, wazuh_agents_ssh.
Mode inference: The GUI exposes a simplified ui_kind (docker / host) + is_local checkbox model. _resolve_manager_mode() maps this to the three internal manager_mode values (docker_local, docker_remote, host_remote) that the Ansible roles expect. If ui_kind == "host", the result is always host_remote. If ui_kind == "docker" and is_local is set or no IP is provided, the result is docker_local; otherwise docker_remote.
Group migration on edit: When a node's connection type changes (e.g., local to remote), update_manager() detects the old group, deletes the host from it, and inserts it into the new group — all within a single locked write, preserving all other inventory entries.
Credential co-location: save_credential() delegates to vault.encrypt_host_vars(), which writes the Ansible Vault-encrypted host_vars/<name>.yml file. delete_manager() and delete_agent() call delete_credential() automatically, ensuring no orphaned host_vars/ files remain after a node is removed.
External service credentials: connectors.py
Manages credentials and URLs in .env at the RADAR root. The module defines FIELD_MAP, a 27-entry dict mapping GUI field IDs to environment variable names, and PASSWORD_KEYS, a 5-entry subset mapping the five secret field IDs to their environment variable names:
PASSWORD_KEYS = {
    "os-pass":         "OS_PASS",
    "wazuh-pass":      "WAZUH_AUTH_PASS",
    "dashboard-pass":  "DASHBOARD_PASS",
    "smtp-pass":       "SMTP_PASS",
    "decipher-token":  "DECIPHER_TOKEN",
}
The /api/connectors/reveal endpoint checks the incoming request body key against set(PASSWORD_KEYS.values()) — the environment variable names, not the field IDs. The request must therefore send the environment variable name (e.g. "OS_PASS"), and the endpoint refuses any key not in that set of five values.
SSL verification fields (*-ssl-enabled) are handled separately from FIELD_MAP via a dedicated ssl_prefix_map in save_connector(): if the value is "false", the corresponding *_VERIFY_SSL environment variable is set to "false"; if a CA certificate is present in the same request, its content is written to .certs/<name>-ca.pem (chmod 0600) and the path is stored as the environment variable value; otherwise the environment variable is set to "true". Certificate content fields (*-cert-content) are silently skipped in the main field loop since they are consumed by the SSL branch.
All .env writes are performed inside save_connector(), threading.Lock block. _write_env() is called from within that lock and preserves existing comments and unrelated keys by parsing the file line by line, replacing only lines whose key appears in the updated environment dictionary. New keys not previously in the file are appended. The final write uses atomic temp-file replacement (.env.tmp -> .env).
Subprocess streaming: deploy.py
Builds the shell command for build-radar.sh, run-radar.sh, or health-radar.sh from the validated spec dict, then streams the subprocess output to the client via Flask's stream_with_context generator.
Validation before execution: _validate_scenario() and _validate_mode() raise ValueError before any subprocess is spawned if the inputs are invalid. The error is yielded as [ERROR] ... to the output stream, not returned as a JSON error, because the stream has already been opened with mimetype="text/plain".
Vault and SSH context injection: If the deployment targets remote nodes and encrypted host_vars/ files exist, _stream_with_vault() creates a temp vault password file (via vault.password_file()) and passes it as ANSIBLE_VAULT_PASSWORD_FILE in the environment, then wraps the subprocess environment in vault.ssh_askpass_env() to load the SSH key into a short-lived ssh-agent.
Termination: The streaming generator wraps subprocess.Popen in a try/finally. When the operator clicks Stop, the JavaScript frontend calls AbortController.abort(), which raises an AbortError in the browser and closes the HTTP connection on the client side. Flask's stream_with_context generator then has no consumer to yield to, exits its loop, and reaches the finally block, which calls proc.terminate() followed by proc.wait(timeout=5), then proc.kill() if the timeout expires.
Run action exception: stream_run (Run Anomaly Detector tab) skips vault and SSH pre-flight checks entirely and passes no vault password file to the subprocess. run-radar.sh operates only against OpenSearch via HTTP using credentials from .env — it requires no Ansible or SSH.
Per-node health checks: health.py
Runs ansible-playbook against the health_check role using subprocess.run() with a 180-second timeout, passing the node's inventory hostname as the --limit value and a set of extra vars including gui_json_output: true and a temp file path for structured results.
The playbook writes a JSON file at the temp path during execution. check_manager() and check_agent() read this file after subprocess.run() returns and parse the checks array from it. If the file is absent or empty, the function falls back to parsing Ansible's stdout for OK/WARN/FAIL-prefixed lines.
Results are aggregated into an overall status: "fail" if any check failed, "warn" if any check warned and none failed, "ok" otherwise. Temp files are deleted in finally blocks regardless of outcome.
Credential session store and SSH agent management: vault.py
In-memory session store: Vault passwords and SSH passphrases are stored in module-level dictionaries (_passwords, _ssh_passphrases) keyed by a session ID (secrets.token_urlsafe(24)). The session ID is issued as an HttpOnly, SameSite=Lax cookie (radar_vault_sid) on first vault or SSH interaction. Neither the vault password nor the SSH passphrase is ever written to disk in the session store.
password_file context manager: When Ansible needs the vault password, it is written to a tempfile.mkstemp() file (prefix radar_vault_, suffix .pw, chmod 0600) for the duration of the with block and deleted in finally. This satisfies Ansible's --vault-password-file requirement while minimising the time the password exists on disk.
ssh_askpass_env context manager: When a remote Ansible run is needed with a passphrase-protected SSH key, this context manager:
- Writes the passphrase to a
tempfile.mkstemp()file (prefixradar_sshpp_, suffix.txt, chmod 0600). - Writes a one-line
#!/bin/sh; cat <passphrase_file>script to a secondtempfile.mkstemp()file (prefixradar_askpass_, suffix.sh, chmod 0700). - Spawns
ssh-agent -sand parsesSSH_AUTH_SOCKandSSH_AGENT_PIDfrom its stdout. - Runs
ssh-addwithSSH_ASKPASSpointing to the helper script andSSH_ASKPASS_REQUIRE=force. - Falls back to
sshpassifssh-addfails andsshpassis installed. - Yields the modified environment dict (with
SSH_AUTH_SOCK,SSH_AGENT_PID, andANSIBLE_PRIVATE_KEY_FILEset) to the caller. - Kills the agent with
ssh-agent -kand deletes both temp files infinally.
The design decision to use a real ssh-agent process rather than passing the passphrase through other means is driven by compatibility: Ansible's SSH connector respects SSH_AUTH_SOCK universally, whereas direct passphrase injection is not portable across OpenSSH versions.
Vault unlock verification: api_vault_unlock() does not accept the vault password on trust. It calls vault.verify_password(), which runs ansible-vault view --vault-password-file <tmp> <file> against an existing encrypted file in host_vars/. Only if that subprocess exits 0 is the password retained in the session. If verification fails, the password is immediately cleared from the session and a 400 error is returned naming the file that failed to decrypt.
Session and security model
The vault session does not survive a Flask process restart. This is by design: keeping state only in process memory means no session database to maintain, no session files to protect, and a clean security boundary.
The vault badge in the UI reflects session state: amber if encrypted host_vars/ files exist but the vault is locked, green if unlocked, absent if no encrypted files exist. This state is polled by the frontend via /api/vault/status on page load.
File I/O consistency
All file mutations across the orchestrator modules follow the same pattern:
- Acquire a module-level
threading.Lock. - Read the current file contents.
- Apply the change in memory.
- Write to a
.tmpsibling file. - Atomically rename
.tmp-> target. - Release the lock.
The temp file suffixes by module: ar.yaml.tmp (ar_config), inventory.yaml.tmp (inventory), .env.tmp (connectors). This ensures that a concurrent request or an unexpected process termination during step 4 never leaves a half-written config file.
Parent links: SRS-063 RADAR SOAR Web Interface - REST API, SRS-064 RADAR SOAR Web Interface - Frontend
3.0 RADAR Ansible
Software design specifications for RADAR Ansible.
3.1 RADAR configuration management design SWD-032
This document specifies the design and structure of RADAR's configuration management system, which coordinates anomaly detection scenarios, active response policies, and deployment parameters across multiple configuration files.
Configuration architecture

config.yaml structure
Primary configuration file for anomaly detection scenarios.
Schema
default_scenario: <scenario_name>

scenarios:
  <scenario_name>:
    # Index configuration
    index_prefix: <index_prefix>
    result_index: <result_index_name>
    log_index_pattern: <pattern>
    time_field: <timestamp_field>

    # Detector configuration
    detector_interval: <minutes>
    delay_minutes: <minutes>
    categorical_field: <field_name>
    shingle_size: <integer>

    # Monitor configuration
    monitor_name: <name>
    trigger_name: <name>
    anomaly_grade_threshold: <float 0-1>
    confidence_threshold: <float 0-1>
    monitor_interval: <minutes>  # Optional: defaults to detector_interval

    # Features (RCF aggregations)
    features:
      - feature_name: <name>
        feature_enabled: <boolean>
        aggregation_query:
          <feature_name>:
            <aggregation_type>:
              field: <field_name>

    # Optional: Docker/testing
    container_name: <docker_service_name>
    container_port: <port>
    dataset_dir: <path>
    label_csv_path: <path>

webhook:
  name: <webhook_destination_name>
  url: <webhook_endpoint_url>
Example: log_volume scenario
log_volume:
  index_prefix: wazuh-ad-<scenario>-*
  result_index: opensearch-ad-plugin-result-<scenario>
  time_field: "@timestamp"
  detector_interval: <minutes>
  monitor_name: "<Scenario>-Monitor"
  anomaly_grade_threshold: <0.0-1.0>
  features:
    - feature_name: <unique_name>
      feature_enabled: true
      aggregation_query:
        <feature_name>:
          <aggregation_type>:
            field: <field_path>
Full example: See radar/config.yaml for complete log_volume scenario
Configuration parameters
| Parameter | Type | Required | Description |
|---|---|---|---|
index_prefix |
string | Yes | OpenSearch index pattern for input data |
result_index |
string | Yes | Index name for detector results |
time_field |
string | Yes | Timestamp field for time series analysis |
detector_interval |
int | Yes | Detector execution frequency (minutes) |
delay_minutes |
int | Yes | Window delay for data ingestion lag (minutes) |
categorical_field |
string | No | High-cardinality field for per-entity baselines |
shingle_size |
int | No | Number of consecutive intervals in sliding window (default: 8) |
monitor_name |
string | Yes | OpenSearch monitor name |
trigger_name |
string | Yes | Monitor trigger name |
anomaly_grade_threshold |
float | Yes | Minimum anomaly grade to trigger (0.0-1.0) |
confidence_threshold |
float | Yes | Minimum confidence to trigger (0.0-1.0) |
features |
list | Yes | List of feature definitions (aggregations) |
Feature definition
Each feature defines an OpenSearch aggregation for the RCF detector:
- feature_name: <unique_identifier>
  feature_enabled: true
  aggregation_query:
    <feature_name>:  # Must match feature_name above
      <aggregation_type>:  # avg, max, sum, value_count, cardinality
        field: <field_name>
Supported aggregation types:
avg: Average valuemax: Maximum valuesum: Sum of valuesvalue_count: Count of non-null valuescardinality: Count of distinct values
ar.yaml structure
Active response configuration file defining risk calculation and mitigation policies.
Schema
scenarios:
  <scenario_name>:
    # Rule mappings
    ad:
      rule_ids: [<rule_ids>]
    signature:
      rule_ids: [<rule_ids>]

    # Risk weights (must sum to ~1.0)
    w_ad: <float>
    w_sig: <float>
    w_cti: <float>

    # Time windows
    delta_ad_minutes: <int>
    delta_signature_minutes: <int>

    # Signature risk parameters
    signature_impact: <float 0-1>
    signature_likelihood: <float 0-1> | <list>

    # Risk thresholds
    tiers:
      tier1_min: <float 0-1>
      tier1_max: <float 0-1>
      tier2_max: <float 0-1>

    # Response actions
    mitigations_tier2: [<action_names>]
    mitigations_tier3: [<action_names>]
    allow_mitigation: <boolean>
Example: geoip_detection scenario (minimal)
geoip_detection:
  ad:
    rule_ids: [<rule_ids>]
  signature:
    rule_ids: [<rule_ids>]
  w_ad: <0.0-1.0>
  w_sig: <0.0-1.0>
  w_cti: <0.0-1.0>
  delta_ad_minutes: <minutes>
  signature_impact: <0.0-1.0>
  signature_likelihood: <0.0-1.0>
  tiers:
    tier1_min: <threshold>
    tier1_max: <threshold>
    tier2_max: <threshold>
  mitigations_tier2: [<action_names>]
  mitigations_tier3: [<action_names>]
  allow_mitigation: <boolean>
Full examples: See radar/scenarios/active_responses/ar.yaml
Configuration parameters
| Parameter | Type | Description |
|---|---|---|
ad.rule_ids |
list[str] | Wazuh rule IDs for anomaly detection alerts |
signature.rule_ids |
list[str] | Wazuh rule IDs for signature-based alerts |
w_ad |
float | Weight for AD component (A) in risk formula |
w_sig |
float | Weight for signature component (S) in risk formula |
w_cti |
float | Weight for CTI component (T) in risk formula |
delta_ad_minutes |
int | Time window for correlated AD events (minutes) |
delta_signature_minutes |
int | Time window for correlated signature events (minutes) |
signature_impact |
float | Impact score for signature alerts (0-1) |
signature_likelihood |
float or list | Likelihood score (0-1) or per-rule mappings |
tiers.tier1_min |
float | Minimum risk score for Tier 1; scores below fall into Tier 0 (0-1) |
tiers.tier1_max |
float | Maximum risk score for Tier 1 (0-1) |
tiers.tier2_max |
float | Maximum risk score for Tier 2 (0-1) |
mitigations_tier2 |
list[str] | Mild/reversible mitigation actions executed at Tier 2 |
mitigations_tier3 |
list[str] | Harsh/permanent mitigation actions executed at Tier 3 |
allow_mitigation |
bool | Whether to execute automated mitigations at Tier 2 and Tier 3 |
Risk calculation formula
A = anomaly_grade × confidence
S = signature_impact × signature_likelihood
T = CTI_score (aggregated threat intelligence)

R = w_ad × A + w_sig × S + w_cti × T
Tier determination
if R < tier1_min: Tier 0 (no actions)
elif R < tier1_max: Tier 1 (email + DECIPHER incident)
elif R < tier2_max: Tier 2 (+ mitigations_tier2 if allow_mitigation)
else: Tier 3 (+ mitigations_tier3 if allow_mitigation)
Variable signature likelihood
For scenarios with multiple signature rules of varying severity:
signature_likelihood:
  - rule_id: ["210012", "210013"]
    weight: 0.5
  - rule_id: ["210020", "210021"]
    weight: 0.5
.env file structure
Environment variables for sensitive credentials and endpoints.
Example (minimal with placeholders)
# OpenSearch/Wazuh Indexer
OS_URL=https://<hostname>:<port>
OS_USER=<username>
OS_PASS=<password>
OS_VERIFY_SSL=<true|false>

# Webhook
WEBHOOK_URL=http://<webhook_host>:<port>/notify
WEBHOOK_NAME=<webhook_name>

# DECIPHER (optional)
DECIPHER_BASE_URL=https://<decipher_host>
DECIPHER_VERIFY_SSL=<true|false>
Full example: See radar/env.example
Variables
| Variable | Required | Description |
|---|---|---|
OS_URL |
Yes | OpenSearch/Wazuh Indexer endpoint |
OS_USER |
Yes | OpenSearch username |
OS_PASS |
Yes | OpenSearch password |
OS_VERIFY_SSL |
No | SSL certificate verification (default: true) |
WEBHOOK_URL |
Yes | Webhook service endpoint for monitor notifications |
WEBHOOK_NAME |
No | Webhook destination name (default: "RADAR Webhook") |
DECIPHER_BASE_URL |
No | DECIPHER instance URL (required for CTI enrichment and FlowIntel cases) |
DECIPHER_VERIFY_SSL |
No | SSL certificate verification for DECIPHER (default: false) |
DECIPHER_TIMEOUT_SEC |
No | DECIPHER API request timeout in seconds (default: 30) |
inventory.yaml structure
Ansible inventory defining deployment targets.
Example (structure only)
all:
  children:
    wazuh_manager_local:
      hosts:
        localhost:
          ansible_connection: local
          manager_mode: docker_local

    wazuh_manager_ssh:
      hosts:
        <hostname>:
          ansible_connection: ssh
          ansible_user: <username>
          manager_mode: ssh

    wazuh_agents_ssh:
      hosts:
        <agent_hostname>:
          ansible_connection: ssh
          agent_mode: ssh
Full example: See radar/inventory.yaml
Host groups
| Group | Purpose | Variables |
|---|---|---|
wazuh_manager_local |
Local Docker Compose manager | manager_mode: docker_local |
wazuh_manager_ssh |
Remote SSH manager | manager_mode: ssh |
wazuh_agents_container |
Local Docker Compose agents | agent_mode: docker_local |
wazuh_agents_ssh |
Remote SSH agents | agent_mode: ssh |
volumes.yml structure
Docker Compose volume configuration for bind mount resolution.
Example (structure only)
services:
  wazuh.manager:
    volumes:
      - <host_path>:<container_path>
      - <host_path>:<container_path>
Purpose: Ansible roles parse this file to derive host filesystem paths for direct configuration file manipulation without docker exec.
Full example: See radar/volumes.yml
Configuration validation
config.yaml validation
- detector.py: Validates scenario exists in
scenariossection - detector.py: Ensures required fields present:
time_field,features,index_prefix - monitor.py: Validates
monitor_name,trigger_name, thresholds defined
ar.yaml validation
- radar_ar.py: Validates scenario exists when rule ID triggered
- radar_ar.py: Ensures risk weights sum to approximately 1.0
- radar_ar.py: Validates tier thresholds are monotonically increasing
.env validation
- build-radar.sh: Ensures
OS_URLandWEBHOOK_URLset before execution - detector.py, monitor.py, webhook.py: Validate required credentials present
Configuration precedence
- Command-line arguments: Override all other sources (e.g.,
--scenario) - Environment variables: Loaded from
.envfile - config.yaml: Scenario-specific defaults
- ar.yaml: Active response policies
- Hard-coded defaults: Fallback values in Python modules
Best practices
- Version control: Keep config.yaml, ar.yaml, and inventory.yaml in Git
- Secrets management: Never commit
.envfile; use.env.exampletemplate - Validation: Test configuration changes in lab environment before production
- Documentation: Comment complex likelihood mappings and custom thresholds
- Consistency: Keep
scenario_nameconsistent across all configuration files - Incremental changes: Modify one parameter at a time for easier troubleshooting
Parent links: LARC-024 RADAR Ansible deployment pipeline flow, LARC-025 RADAR helper enrichment pipeline
3.2 RADAR data ingestion module design SWD-033
This document specifies the design of RADAR's data ingestion modules (wazuh_ingest.py) that generate synthetic time-series data for training OpenSearch RCF anomaly detectors.
Purpose
Behavior-based anomaly detection scenarios require historical baseline data to establish normal patterns. The data ingestion modules generate synthetic time-series data that:
- Mimics realistic operational patterns
- Provides sufficient training data (typically 240 minutes)
- Aligns with Wazuh data schema
- Enables immediate detector training without waiting for real data accumulation
Architecture

Module structure
Common utility functions
Required functions:
load_env(env_path): Load environment variables from .env fileiso(dt): Convert datetime to ISO 8601 string with Z suffixos_post(url, auth, verify_tls, body): Execute OpenSearch POST request with error handling
Main workflow algorithm
Processing steps:
- Build radar-cli: Create Docker image with detector/monitor/webhook tools
- Load configuration: Read OS_URL, OS_USER, OS_PASS from .env
- Configure parameters: Set agent_id, agent_name, lookback minutes, sampling interval
- Query baseline: Retrieve recent documents for baseline calculation
- Calculate baseline: Determine starting value and delta (growth rate)
- Generate time series: Create synthetic documents with timestamps and values
- Bulk index: Send documents to OpenSearch via Bulk API
- Validate: Check bulk response for errors
Scenario-specific implementations
Log volume scenario
Index: wazuh-ad-log-volume-*
Document schema:
{
  "@timestamp": "2026-02-16T10:00:00Z",
  "agent": {
    "name": "edge.vm",
    "id": "001"
  },
  "data": {
    "log_path": "/var/log",
    "log_bytes": 228654752
  },
  "predecoder": {
    "program_name": "log_volume_metric"
  }
}
Baseline calculation algorithm:
- Query last 10 minutes for 2 most recent documents
- Sort by @timestamp descending
- Extract metric values from both documents
- Calculate delta (growth rate):
delta = value1 - value2 - Use fallback delta (e.g., 20000) if insufficient data
Time series generation algorithm:
- Calculate total points:
(lookback_minutes * 60) / step_seconds - Calculate start value:
first_value - delta * (total_points - 1) - For each point i:
- Timestamp:
start_time + (i * step_seconds)- Value:start_value + delta * i- Create document with timestamp, agent info, and metric value
Characteristics:
- Linear growth pattern
- Monotonically increasing values
- Realistic byte count magnitudes
- 20-second sampling intervals
Suspicious login scenario
Index: wazuh-ad-suspicious-login-*
Document schema (varies by implementation):
{
  "@timestamp": "2026-02-16T10:00:00Z",
  "agent": {"name": "edge.vm"},
  "data": {
    "srcuser": "alice",
    "srcip": "192.168.1.10"
  },
  "rule": {"id": "5715", "level": 3}
}
Baseline calculation: - Query authentication frequency patterns - Calculate average session intervals - Determine normal user login counts per hour
Bulk indexing
NDJSON format specification
OpenSearch Bulk API requires newline-delimited JSON format:
-
Each document requires two lines:
- Action metadata:
{"index": {"_index": "<index_name>"}} - Document source:
{"@timestamp": "...", "agent": {...}, "data": {...}}
- Action metadata:
-
Lines separated by
\n - Payload must end with
\n
Bulk request construction algorithm
- Initialize empty lines array
- For each document:
- Append action metadata line (JSON)
- Append document source line (JSON)
- Join lines with newline separator
- Append final newline
- POST to
{os_url}/_bulkwith:
- Content-Type:
application/x-ndjson - Basic authentication
- Timeout: 30 seconds
Batch size considerations
- Default: 500-1000 documents per bulk request
- Log volume scenario: ~720 documents (240 minutes × 3 points/minute)
- Trade-offs: Larger batches reduce network overhead but increase memory usage
Error handling requirements
Connection errors
- Check HTTP status code
- Accept only 200 or 201 responses
- Raise error with status code and response text on failure
Bulk response validation
- Parse JSON response
- Check for
errorsfield - Iterate through
itemsarray - Log any item containing
errorfield - Exit with non-zero status if errors found
Configuration validation
- Verify OS_URL, OS_USER, OS_PASS are set
- Log missing variables to stderr
- Exit with status 2 if configuration incomplete
Configuration parameters
| Parameter | Type | Default | Description |
|---|---|---|---|
minutes |
int | 240 | Historical data lookback period (minutes) |
step_s |
int | 20 | Time interval between data points (seconds) |
agent_id |
str | "001" | Wazuh agent ID |
agent_name |
str | "edge.vm" | Wazuh agent name |
index_pattern |
str | Scenario-specific | OpenSearch index pattern |
fallback_delta |
int | 20000 | Default growth rate if baseline query fails |
Execution
Via run-radar.sh
docker run --rm --network host \
  --env-file .env \
  -v "$(pwd)/scenarios:/app/scenarios" \
  radar-cli:latest \
  python /app/scenarios/ingest_scripts/log_volume/wazuh_ingest.py
Standalone execution
cd radar
python scenarios/ingest_scripts/log_volume/wazuh_ingest.py
Prerequisites
.envfile with OpenSearch credentials- OpenSearch/Wazuh Indexer accessible
- Target index exists (or auto-create enabled)
- Python packages:
requests
Integration with detector workflow
Sequence in run-radar.sh:
- Ingestion: Execute
wazuh_ingest.pyto populate index - Wait period: Allow time for indexing to complete (e.g., 10 seconds)
- Detector creation: Create OpenSearch AD detector pointing to index
- Training: Detector trains on synthetic historical data
- Real-time detection: Detector begins evaluating real incoming data
Implementation references
Primary implementations:
- radar/scenarios/ingest_scripts/log_volume/wazuh_ingest.py
- radar/scenarios/ingest_scripts/suspicious_login/wazuh_ingest.py
Execution scripts:
- radar/run-radar.sh - Orchestrates ingestion workflow
Best practices
- Realistic patterns: Generate data that mimics actual system behavior
- Sufficient volume: Ensure enough data points for RCF training (minimum ~100 points)
- Timestamp accuracy: Use precise timestamps to avoid detection gaps
- Schema consistency: Match exact field names and types expected by detector
- Index naming: Follow Wazuh index naming conventions with date suffixes
- Error validation: Check bulk response for partial failures
- Idempotency: Support re-running ingestion without duplicates (use unique IDs if needed)
Parent links: LARC-027 RADAR data ingestion pipeline
3.3 RADAR custom rule and decoder patterns SWD-034
This document specifies the design patterns for RADAR's custom Wazuh decoders and rules that enable anomaly detection integration and geographic anomaly detection.
Architecture overview

Decoder patterns
OpenSearch AD decoder
Purpose: Extract anomaly grade, confidence, and entity from webhook-generated AD alerts
File: scenarios/decoders/log_volume/100-opensearch_ad-decoders.xml
<decoder name="opensearch_ad">
  <prematch>^opensearch_ad:</prematch>
</decoder>

<decoder name="opensearch_ad_child">
  <parent>opensearch_ad</parent>
  <regex offset="after_parent">entity="(\.*?)"</regex>
  <order>entity</order>
</decoder>

<decoder name="opensearch_ad_child">
  <parent>opensearch_ad</parent>
  <regex offset="after_parent">grade="(\.*?)"</regex>
  <order>anomaly_grade</order>
</decoder>

<decoder name="opensearch_ad_child">
  <parent>opensearch_ad</parent>
  <regex offset="after_parent">confidence="(\.*?)"</regex>
  <order>anomaly_confidence</order>
</decoder>
Extracted fields:
entity: Agent name or entity identifier from high-cardinality fieldanomaly_grade: Anomaly score (0.0-1.0)anomaly_confidence: Model confidence (0.0-1.0)
Example log line:
Feb 16 10:30:15 wazuh-manager opensearch_ad: LogVolume-Growth-Detected entity="edge.vm" grade="0.85" confidence="0.92"
RADAR SSH decoder (enriched authentication logs)
Purpose: Extract geographic enrichment fields from RADAR Helper
File: scenarios/decoders/suspicious_login/100-radar-ssh-decoders.xml
<decoder name="radar_ssh">
  <prematch>RADAR outcome</prematch>
</decoder>

<decoder name="radar_ssh_outcome">
  <parent>radar_ssh</parent>
  <regex offset="after_parent">outcome='(\w+)'</regex>
  <order>radar_outcome</order>
</decoder>

<decoder name="radar_ssh_country">
  <parent>radar_ssh</parent>
  <regex offset="after_parent">country='(\w*)'</regex>
  <order>radar_country</order>
</decoder>

<decoder name="radar_ssh_geo_velocity">
  <parent>radar_ssh</parent>
  <regex offset="after_parent">geo_velocity_kmh='([\d.]+)'</regex>
  <order>radar_geo_velocity_kmh</order>
</decoder>

<decoder name="radar_ssh_country_change">
  <parent>radar_ssh</parent>
  <regex offset="after_parent">country_change_i='(\d)'</regex>
  <order>radar_country_change_i</order>
</decoder>

<decoder name="radar_ssh_asn_novelty">
  <parent>radar_ssh</parent>
  <regex offset="after_parent">asn_novelty_i='(\d)'</regex>
  <order>radar_asn_novelty_i</order>
</decoder>
Extracted fields:
radar_outcome: "success" or "failure"radar_country: ISO 3166-1 alpha-2 country coderadar_geo_velocity_kmh: Geographic velocity (km/h)radar_country_change_i: Binary indicator (0/1)radar_asn_novelty_i: Binary indicator (0/1)
Local decoder (command output)
Purpose: Extract structured data from command outputs
File: scenarios/decoders/log_volume/local_decoder.xml
<decoder name="local_decoder">
  <prematch>^\d+\s+</prematch>
</decoder>

<decoder name="local_log_bytes">
  <parent>local_decoder</parent>
  <regex>^(\d+)</regex>
  <order>log_bytes</order>
</decoder>
Example log line:
228654752 /var/log
Extracted field: log_bytes: Integer byte count
Rule patterns
Generic OpenSearch AD alert rule
Rule ID: 100300
Purpose: Match all OpenSearch AD alerts for logging/aggregation
<rule id="100300" level="5">
  <decoded_as>opensearch_ad</decoded_as>
  <description>Generic OpenSearch AD Alert</description>
  <group>anomaly_detection,opensearch_ad</group>
</rule>
Scenario-specific AD rule
Rule ID: 100309 (Log Volume)
Purpose: Match specific AD scenario by trigger name
<rule id="100309" level="10">
  <if_sid>100300</if_sid>
  <match>LogVolume-Growth-Detected</match>
  <description>OpenSearch AD: Abnormal log volume growth detected on $(entity)</description>
  <group>anomaly_detection,log_volume,opensearch_ad</group>
</rule>
GeoIP signature-based rule (list-based)
Rule ID: 100900
Purpose: Detect authentication from non-whitelisted countries using CDB list
<rule id="100900" level="10">
  <if_sid>5715</if_sid>  <!-- SSH authentication success -->
  <list field="radar_country" lookup="not_match_key">/var/ossec/etc/lists/whitelist_countries</list>
  <description>SSH connection from non-whitelisted country: $(radar_country) by user $(radar_user) from $(radar_src_ip)</description>
  <group>authentication_success,geoip_detection</group>
</rule>
List file (/var/ossec/etc/lists/whitelist_countries):
US
CA
GB
DE
FR
JP
...
GeoIP signature-based rule (hardcoded fallback)
Rule ID: 100901
Purpose: Hardcoded whitelist as fallback
<rule id="100901" level="10">
  <if_sid>5715</if_sid>
  <field name="srcgeoip" negate="yes">^AT$|^BE$|^BG$|^HR$|^CY$|^CZ$|^DK$|^EE$|^FI$|^FR$|^DE$|^GR$|^HU$|^IE$|^IT$|^LV$|^LT$|^LU$|^MT$|^NL$|^PL$|^PT$|^RO$|^SK$|^SI$|^ES$|^SE$|^GB$|^US$|^CA$</field>
  <description>Connection from a non-EU/US/CA country</description>
  <group>authentication_success,geoip_detection</group>
</rule>
Geographic velocity rule
Rule ID: 210012
Purpose: Detect impossible travel (> 900 km/h)
<rule id="210012" level="10">
  <decoded_as>radar_ssh</decoded_as>
  <field name="radar_geo_velocity_kmh" type="pcre2">^([9]\d{2}|[1-9]\d{3,})</field>
  <description>Suspicious login: Impossible travel detected for user $(srcuser) - velocity $(radar_geo_velocity_kmh) km/h from $(srcip)</description>
  <group>authentication,suspicious_login,impossible_travel</group>
</rule>
Regex explanation: ^([9]\d{2}|[1-9]\d{3,})
[9]\d{2}: 900-999 km/h[1-9]\d{3,}: 1000+ km/h
Country change rule
Rule ID: 210020
Purpose: Detect login from different country than previous
<rule id="210020" level="8">
  <decoded_as>radar_ssh</decoded_as>
  <field name="radar_country_change_i">^1$</field>
  <description>Suspicious login: Country change detected for user $(srcuser) - now in $(radar_country) from $(srcip)</description>
  <group>authentication,suspicious_login,country_change</group>
</rule>
Field extraction patterns
Regex patterns
| Pattern | Matches | Example |
|---|---|---|
entity="(\.*?)" |
Quoted string | entity="edge.vm" |
grade="(\.*?)" |
Decimal number | grade="0.85" |
outcome='(\w+)' |
Single-quoted word | outcome='success' |
geo_velocity_kmh='([\d.]+)' |
Decimal with dot | geo_velocity_kmh='450.23' |
^(\d+) |
Leading integer | 228654752 |
Field types
Numeric comparison:
<field name="radar_geo_velocity_kmh" type="pcre2">^([9]\d{2}|[1-9]\d{3,})</field>
Exact match:
<field name="radar_country_change_i">^1$</field>
List lookup:
<list field="radar_country" lookup="not_match_key">/path/to/list</list>
Rule hierarchy
100300 (Generic AD alert, level 5)
└── 100309 (Log volume specific, level 10)

5715 (SSH auth success, built-in)
└── 100900 (GeoIP non-whitelist, level 10)
└── 100901 (GeoIP hardcoded, level 10)

radar_ssh (decoder parent)
└── 210012 (High velocity, level 10)
└── 210020 (Country change, level 8)
└── 210021 (ASN novelty, level 7)
Deployment via Ansible
Decoder installation
- name: Copy decoders
  copy:
    src: "{{ decoders_src_dir }}/{{ item }}"
    dest: "{{ _host_decoders_dir }}/{{ item }}"
    owner: root
    group: wazuh
    mode: '0640'
  loop:
    - 100-opensearch_ad-decoders.xml
    - 100-radar-ssh-decoders.xml
Rule installation
- name: Inject rules with markers
  blockinfile:
    path: "{{ _host_rules_dir }}/local_rules.xml"
    marker: "<!-- {mark} RADAR {{ scenario_name }} -->"
    block: "{{ lookup('file', rules_src_dir + '/rules.xml') }}"
    owner: root
    group: wazuh
    mode: '0640'
List installation
- name: Copy whitelist
  copy:
    src: "{{ whitelist_src }}"
    dest: "/var/ossec/etc/lists/whitelist_countries"
    owner: root
    group: wazuh
    mode: '0640'
Best practices
- Unique rule IDs: Reserve ID ranges per scenario (e.g., 100900-100999 for GeoIP, 210000-210099 for suspicious login)
- Descriptive messages: Include extracted field values in rule descriptions using
$(field_name) - Appropriate severity: Use level 10 for high-confidence anomalies, 7-8 for medium
- Group tags: Tag rules with scenario groups for filtering and aggregation
- Parent-child decoders: Use parent decoder for prematch, child decoders for field extraction
- Regex anchors: Use
^and$to ensure precise field matching - Marker-based injection: Use Ansible blockinfile markers to enable idempotent updates
Parent links: LARC-028 RADAR GeoIP detection scenario flow, LARC-029 RADAR log volume detection scenario flow
3.4 RADAR webhook service design SWD-035
This document specifies the design of RADAR's webhook service (ad_alerts_webhook.py) that receives OpenSearch monitor notifications and writes them to Wazuh-monitored log files.
Purpose
The webhook service bridges OpenSearch AD monitors with Wazuh's rule engine by:
- Receiving HTTP POST notifications from OpenSearch monitors
- Extracting anomaly details from monitor payloads
- Formatting alerts as syslog entries
- Writing to log files monitored by Wazuh agent
- En abling Wazuh rules to trigger active responses
Architecture

Flask application structure
Route handler specification
Endpoint: /notify
Method: POST
Content-Type: application/json
Behavior:
- Parse incoming JSON payload from OpenSearch monitor
- Extract required fields: monitor name, trigger name, entity, period timestamps, anomaly scores
- Format fields as syslog-compatible log entry
- Append formatted entry to monitored log file
- Return success response with HTTP 200
Error handling:
- Invalid JSON → HTTP 400
- Missing fields → Use default values ("UnknownMonitor", "UnknownTrigger", empty string)
- File I/O errors → HTTP 500 (optional explicit handling)
Request/response specification
Request format
Method: POST
Endpoint: /notify
Headers:
Content-Type: application/json
Body (JSON):
{
  "monitor": {
    "name": "LogVolume-Monitor"
  },
  "trigger": {
    "name": "LogVolume-Growth-Detected"
  },
  "entity": "edge.vm",
  "periodStart": "2026-02-16T10:25:00Z",
  "periodEnd": "2026-02-16T10:30:00Z",
  "anomaly_grade": "0.85",
  "anomaly_confidence": "0.92"
}
Response format
Success (HTTP 200):
{
  "status": "written"
}
Error (HTTP 400):
{
  "error": "invalid JSON"
}
Log output format
Template
{timestamp} {hostname} ad_alert: OpenSearchAD {trigger_name}: entity="{entity}", start="{periodStart}", end="{periodEnd}", anomaly_grade="{grade}", anomaly_confidence="{confidence}"
Example output
Feb 16 10:30:15 wazuh-manager ad_alert: OpenSearchAD LogVolume-Growth-Detected: entity="edge.vm", start="2026-02-16T10:25:00Z", end="2026-02-16T10:30:00Z", anomaly_grade="0.85", anomaly_confidence="0.92"
Field mapping
| Payload field | Log field | Example |
|---|---|---|
trigger.name |
Trigger name | LogVolume-Growth-Detected |
entity |
entity |
edge.vm |
periodStart |
start |
2026-02-16T10:25:00Z |
periodEnd |
end |
2026-02-16T10:30:00Z |
anomaly_grade |
anomaly_grade |
0.85 |
anomaly_confidence |
anomaly_confidence |
0.92 |
Deployment
Docker deployment
The webhook service can be deployed as a Docker container with:
- Base image: Python 3.10 slim
- Dependencies: Flask, Gunicorn
- Exposed port: 8080
- Volume mount:
/var/logfor log file access - Restart policy: unless-stopped
Reference: See radar/webhook/Dockerfile and docker-compose.webhook.yml
Standalone deployment (systemd)
The service can run as a systemd unit with:
- User: root (for log file write access)
- Working directory:
/opt/radar/webhook - Exec command: Gunicorn binding to
0.0.0.0:8080 - Restart policy: on-failure with 5-second delay
Service start:
systemctl daemon-reload
systemctl enable ad-webhook
systemctl start ad-webhook
Production considerations
WSGI server (Gunicorn)
Flask's built-in server is not production-ready. Production deployment should use Gunicorn with:
- Workers: 2-4 for typical AD monitoring workloads
- Timeout: 30 seconds (webhook writes are fast)
- Logging: Separate access and error log files
File permissions
Log file must be writable by webhook service:
touch /var/log/ad_alerts.log
chown root:root /var/log/ad_alerts.log
chmod 644 /var/log/ad_alerts.log
Log rotation schema
Configuration in /etc/logrotate.d/ad_alerts:
- Rotation: Daily
- Retention: 7 days
- Compression: Enabled (delayed by 1 day)
- Post-rotation: Reload webhook service
Error handling
Invalid JSON
Requests with invalid JSON payloads receive HTTP 400 response.
Missing fields
Missing fields are handled gracefully using default values:
- Monitor name → "UnknownMonitor"
- Trigger name → "UnknownTrigger"
- Entity → empty string
- Timestamps → empty string
- Anomaly scores → empty string
File I/O errors
File write failures can optionally return HTTP 500 with error message.
Integration with Wazuh
Wazuh agent configuration
ossec.conf snippet:
<localfile>
  <log_format>syslog</log_format>
  <location>/var/log/ad_alerts.log</location>
</localfile>
Decoder application
Wazuh manager applies opensearch_ad decoder to extract:
entityanomaly_gradeanomaly_confidence
Rule triggering
Extracted fields enable rule matching (e.g., rule 100309 for log volume scenario)
Testing
Manual test with curl
curl -X POST http://localhost:8080/notify \
  -H "Content-Type: application/json" \
  -d '{
    "monitor": {"name": "Test-Monitor"},
    "trigger": {"name": "Test-Trigger"},
    "entity": "test-entity",
    "periodStart": "2026-02-16T10:00:00Z",
    "periodEnd": "2026-02-16T10:05:00Z",
    "anomaly_grade": "0.95",
    "anomaly_confidence": "0.98"
  }'
Expected response:
{"status":"written"}
Verify log:
tail -n 1 /var/log/ad_alerts.log
Integration test
- Start webhook service
- Create OpenSearch monitor with webhook destination
- Trigger anomaly (or use synthetic data)
- Verify monitor sends notification
- Check log file for entry
- Verify Wazuh rule triggers
Configuration summary
| Setting | Value | Description |
|---|---|---|
| Host | 0.0.0.0 |
Listen on all interfaces |
| Port | 8080 |
HTTP port for webhook endpoint |
| Endpoint | /notify |
Webhook notification receiver |
| Log file | /var/log/ad_alerts.log |
Output log file monitored by Wazuh |
| Method | POST | HTTP method for notifications |
| Content-Type | application/json | Request payload format |
Security considerations
- Network isolation: Run webhook on management network, not public internet
- Authentication: Add API key validation if needed (not implemented in basic version)
- Rate limiting: Consider adding rate limits to prevent DoS
- Input validation: Sanitize inputs to prevent log injection attacks
- HTTPS: Use reverse proxy (nginx) with TLS for production
Implementation
See radar/webhook/ad_alerts_webhook.py for complete implementation.
Parent links: LARC-023 RADAR monitor and webhook workflow, LARC-029 RADAR log volume detection scenario flow
3.5 RADAR model security and adversarial defense implementation SWD-036
This document specifies RADAR's defensive mechanisms against adversarial machine learning attacks targeting anomaly detection systems.
Defense architecture
RADAR implements a defense-in-depth strategy with five protective layers:

Layer 1: Baseline protection
Clean data initialization
Implementation:
# ar.yaml configuration
baseline_init:
  use_gold_standard: true
  clean_period_start: "2026-01-01T00:00:00Z"
  clean_period_end: "2026-01-15T00:00:00Z"
  excluded_hosts: ["suspected-compromised-01"]
  verification_method: "manual_review"
Process:
- Identify clean period: Select time range with no known security incidents
- Honeypot analysis: Ensure no attacker presence during period
- Manual verification: SOC analysts review and approve baseline data
- Gold-standard snapshot: Export verified baseline for future reference
Detector initialization logic:
- Check if
use_gold_standardis enabled in config - If enabled:
- Load gold-standard dataset for configured clean period
- Exclude any compromised hosts from baseline
- Train detector on verified clean data
- Log detector ID and initialization status
Digital clean room exercises
Purpose: Establish pristine baselines by temporarily isolating systems
Procedure:
- Schedule maintenance window
- Isolate network segment from potential attackers
- Run systems in clean state (fresh OS, verified binaries)
- Collect baseline data (1-2 weeks)
- Export and preserve as gold-standard
- Return to normal operations
Layer 2: Concept drift detection
Baseline shift monitoring
Drift detection algorithm:
Inputs:
current_stats: Recent window statistics (mean, variance)historical_stats: Historical baseline statisticsthreshold: Maximum allowed shift ratio (default: 0.2 or 20%)
Algorithm:
- Calculate mean shift: $\text{mean_shift} = \frac{|\mu_{\text{current}} - \mu_{\text{historical}}|}{\mu_{\text{historical}}}$
- Calculate variance shift: $\text{var_shift} = \frac{|\sigma^2_{\text{current}} - \sigma^2_{\text{historical}}|}{\sigma^2_{\text{historical}}}$
- If mean_shift > threshold OR var_shift > threshold: - Log warning with shift values - Return True (drift detected)
- Else: Return False (no drift)
Monitoring metrics:
- Mean shift: Change in average feature values
- Variance shift: Change in data distribution spread
- Distribution shape: Kolmogorov-Smirnov test for distribution changes
- Correlation changes: Feature relationship alterations
Manual approval gates
Workflow:

Manual approval workflow:
-
If drift detected:
- Freeze automatic baseline updates (set mode to "manual")
- Generate drift report with current vs. historical statistics
- Create case in SOAR platform with title "Concept Drift Detected"
- Notify SOC analysts for review
-
Analyst reviews drift:
- If legitimate (e.g., infrastructure change): Approve new baseline, resume updates
-
If suspicious: Investigate potential attack, rollback to previous baseline
severity="medium",
required_action="baseline_approval"
Layer 3: Multi-layer validation
Hybrid detection approach
RADAR combines three detection methods for resilience:
| Layer | Technology | Attack Resilience | False Positive Rate |
|---|---|---|---|
| Signature-based | Wazuh rules, Suricata | High (known attacks) | Low |
| Multivariate AD | SONAR MVAD, ADBox MTAD-GAT | Medium (temporal correlations) | Medium |
| Streaming AD | OpenSearch RRCF | Medium (statistical outliers) | High |
Fusion algorithm:
Inputs:
signature_alerts: Alerts from Wazuh/Suricatamvad_alerts: Alerts from SONAR MVAD or ADBoxrrcf_alerts: Alerts from OpenSearch RCF
Algorithm:
-
For each signature alert:
- Find correlated AD alerts within time window (default: 5 minutes)
- If matching AD alerts found:
- Set confidence: "high"
- Attach corroboration details
- Tag with layers: ["signature", "anomaly_detection"]
- Else:
- Set confidence: "medium"
- Tag with layers: ["signature"]
- Append to fused alerts list
-
Return fused alerts
Result: Multi-layer correlation increases confidence and reduces false positives
Cross-layer correlation
Scenario: Detect data poisoning attempts
- RRCF detects anomaly: Unusual pattern in training data
- Signature-based detects nothing: Attack uses novel technique
- MVAD confirms: Temporal correlations show subtle baseline shift
- Fusion decision: Flag for human review due to multi-layer agreement
Layer 4: Human-in-the-loop
Transparent model reasoning
SHAP value explanation algorithm:
- Extract SHAP feature contributions from anomaly event
- Rank features by absolute contribution value (descending)
- Select top 5 contributing features
-
For each feature:
- Retrieve normal range from baseline
- Compare actual value to normal range
- Calculate deviation percentage
-
Generate explanation document with:
- Timestamp and entity
- Anomaly score
- List of top contributing features with normal vs. actual values
Dashboard display format:
Anomaly Explanation - <entity> (<timestamp>)
Anomaly Score: <score> (<severity>)

Top Contributing Factors:
1. <feature_name>: <contribution>
   Normal: <range>, Actual: <value> (<deviation>%)
2. ...
Analyst feedback loops
Feedback collection structure:
anomaly_id: Unique anomaly identifieranalyst_id: Analyst who provided feedbacktimestamp: Feedback submission timeclassification: True positive / False positiveattack_type: If true positive, attack categoryfalse_positive_reason: If false positive, explanationsuggested_threshold: Optional threshold adjustment
Feedback processing logic:
- Store feedback record in database
- If classified as true positive AND retraining recommended: - Trigger model update with anomaly labeled as "attack"
- If false positive with threshold suggestion: - Queue threshold adjustment for analyst approval
Layer 5: System hardening
Cryptographic log integrity
SHA-256 hashing chain algorithm:
Initialization:
- Genesis hash:
"0" * 64(64 zero characters) - Previous hash: Genesis hash
Append operation:
- Get current timestamp (ISO format)
- Concatenate:
entry_data = timestamp | log_entry | prev_hash - Compute SHA-256 hash:
entry_hash = SHA256(entry_data) - Write to log:
timestamp | log_entry | prev_hash | entry_hash - Update prev_hash:
prev_hash = entry_hash
Verification operation:
- Initialize prev_hash to genesis hash
- For each line in log:
- Parse: timestamp, entry, stored_prev_hash, stored_entry_hash
- Recompute:
expected_hash = SHA256(timestamp | entry | stored_prev_hash)- Verify:expected_hash == stored_entry_hashANDstored_prev_hash == prev_hash- If mismatch: Return False (integrity compromised) - Update:prev_hash = stored_entry_hash - Return True (integrity verified)
Model file access controls
File system permissions:
# Detector models read-only for application
chown root:wazuh /var/ossec/models/*.pkl
chmod 640 /var/ossec/models/*.pkl

# Training directory restricted
chown wazuh-trainer:wazuh /var/ossec/models/training/
chmod 750 /var/ossec/models/training/
Process isolation (systemd):
[Service]
User=wazuh-detector
Group=wazuh
ReadOnlyDirectories=/var/ossec/models
PrivateTmp=true
ProtectSystem=strict
ProtectHome=true
Training pipeline authentication
API authentication workflow:
- Extract API key from request header:
X-API-Key -
Validate API key:
- Check key exists and is valid
- Verify required role:
model_trainer - If invalid: Return 401 Unauthorized
-
Retrieve requester identity from API key
-
Create audit log entry:
- Trainer ID
- Source IP address
- Timestamp
- Training parameters
-
Execute training with signed inputs
- Return model ID on success (200 OK)
Adversarial attack scenarios and defenses
| Attack Type | Defense Mechanism | Detection Method |
|---|---|---|
| Data poisoning | Gold-standard baselines, concept drift detection | Baseline shift monitor |
| Evasion attacks | Multi-layer validation, signature-based fallback | Alert fusion engine |
| Model extraction | API rate limiting, query obfuscation | Audit logs, query pattern analysis |
| Backdoor injection | Model file integrity checks, signed models | Cryptographic verification |
| Training data manipulation | Clean room initialization, manual approval | Human review of drift |
Configuration schema
adversarial_defense:
  baseline_protection:
    use_gold_standard: <boolean>
    clean_period_days: <integer>
    verification_required: <boolean>

  concept_drift:
    enable_monitoring: <boolean>
    mean_threshold: <0.0-1.0>
    variance_threshold: <0.0-1.0>
    require_manual_approval: <boolean>

  multi_layer_validation:
    enable_correlation: <boolean>
    correlation_window_minutes: <integer>
    min_corroborating_layers: <integer>

  human_in_loop:
    enable_explanations: <boolean>
    require_feedback: <boolean>
    feedback_threshold_alerts: <integer>

  system_hardening:
    log_integrity_hashing: <boolean>
    model_file_signing: <boolean>
    api_authentication: <boolean>
Implementation references
Primary implementations:
- Concept drift monitoring: radar/anomaly_detector/detector.py
- Alert fusion: radar/anomaly_detector/monitor.py
- Log integrity: Security utilities in radar/
Configuration:
- Defense policies: radar/scenarios/active_responses/ar.yaml
Parent links: HARC-015 RADAR adversarial ML defense architecture, LARC-031 RADAR adversarial defense implementation flow
3.6 RADAR-SONAR integration design SWD-037
This document specifies the design for integrating SONAR (multivariate anomaly detection) with RADAR (automated response), enabling SONAR to ship detected anomalies to Wazuh for triggering active responses.
Integration architecture

Data flow
1. SONAR anomaly detection
Input: Wazuh alerts from indexer
Processing:
sonar detect --scenario my_scenario.yaml
Output: Anomaly scores with metadata
2. Anomaly document creation
Pipeline processing specification (sonar/pipeline.py):
Input: List of AnomalyResult objects from MVAD engine
Document structure:
{
  "@timestamp": "<ISO8601>",
  "sonar": {
    "scenario": "<scenario_name>",
    "model_name": "<model_name>",
    "anomaly_score": <float>,
    "severity": "<low|medium|high>",
    "is_anomaly": <boolean>,
    "interpretation": "<explanation>"
  },
  "alert": {
    "original_alert_id": "<id>",
    "rule_id": "<rule_id>",
    "rule_description": "<description>"
  },
  "agent": {"name": "<name>", "id": "<id>"},
  "data": {<original_alert_fields>}
}
Conversion algorithm:
-
For each anomaly result:
- Extract timestamp, scenario, model info
- Map score to severity (low/medium/high)
- Include original alert metadata
- Preserve agent information
- Attach original data fields
-
Return list of documents
3. Shipping to Wazuh Indexer
Shipper module specification (sonar/shipper/shipper.py):
Class: SONARShipper
Initialization:
-
Create OpenSearch client with:
- Host URL from config
- HTTP basic auth (username, password)
- SSL verification setting
-
Set index pattern (default: "sonar-anomalies")
Shipping algorithm:
-
Build bulk actions list:
- For each document: Create action with
_indexand_source
- For each document: Create action with
-
Execute bulk indexing:
- Use OpenSearch
helpers.bulk()function - Set
raise_on_error=Falsefor partial failure handling
- Use OpenSearch
-
Return result:
success: Number of documents indexed successfullyfailed: Number of failed documentstotal: Total documents attempted
Scenario configuration (sonar/scenarios/my_scenario.yaml):
name: "high_risk_alerts"
model_name: "mvad_high_risk_v1"

# ... detection config ...

shipping:
  enabled: true
  scenario_id: "sonar_high_risk"
  index_pattern: "sonar-anomalies"
  ship_all: false  # Only ship detected anomalies
  severity_threshold: "medium"  # Ship medium and high severity
4. Wazuh ingestion and rule matching
Data stream template:
Create index template for SONAR anomalies:
{
  "index_patterns": ["sonar-anomalies*"],
  "template": {
    "mappings": {
      "properties": {
        "@timestamp": {"type": "date"},
        "sonar": {
          "properties": {
            "scenario": {"type": "keyword"},
            "anomaly_score": {"type": "float"},
            "severity": {"type": "keyword"},
            "is_anomaly": {"type": "boolean"}
          }
        },
        "agent": {
          "properties": {
            "name": {"type": "keyword"},
            "id": {"type": "keyword"}
          }
        }
      }
    }
  }
}
Wazuh decoder (100-sonar-decoder.xml):
<decoder name="sonar_anomaly">
  <prematch>\"sonar\"</prematch>
  <type>json</type>
  <plugin_decoder>JSON_Decoder</plugin_decoder>
</decoder>
Wazuh rules (100-sonar-rules.xml):
<!-- Generic SONAR anomaly -->
<rule id="100400" level="5">
  <decoded_as>sonar_anomaly</decoded_as>
  <field name="sonar.is_anomaly">true</field>
  <description>SONAR multivariate anomaly detected</description>
  <group>anomaly_detection,sonar</group>
</rule>

<!-- High severity SONAR anomaly -->
<rule id="100401" level="10">
  <if_sid>100400</if_sid>
  <field name="sonar.severity">high</field>
  <description>SONAR high-severity anomaly: $(sonar.scenario) on agent $(agent.name)</description>
  <group>anomaly_detection,sonar,high_severity</group>
</rule>

<!-- Scenario-specific rules -->
<rule id="100410" level="10">
  <if_sid>100400</if_sid>
  <field name="sonar.scenario">high_risk_alerts</field>
  <description>SONAR detected anomalous pattern in high-risk alerts</description>
  <group>anomaly_detection,sonar,high_risk</group>
</rule>
5. Active response integration
ar.yaml configuration:
scenarios:
  sonar_high_risk:
    ad:
      rule_ids:
        - "100401"  # High-severity SONAR
        - "100410"  # High-risk scenario
    signature:
      rule_ids: []
    w_ad: 0.8
    w_sig: 0.0
    w_cti: 0.2
    delta_ad_minutes: 10
    delta_signature_minutes: 1
    signature_impact: 0.0
    signature_likelihood: 0.0
    risk_threshold: 0.51
    tiers:
      tier1_max: 0.33
      tier2_max: 0.66
    mitigations:
      - isolate_host
      - terminate_service
    create_case: true
    allow_mitigation: true
Active response handling (radar_ar.py):
SONAR alerts are processed like any other AD scenario:
- Scenario identification: Maps rule 100410 →
sonar_high_risk - Context collection: Queries recent alerts for affected agent
- Risk calculation: Applies weights (w_ad=0.8, w_cti=0.2)
- Tier determination: Based on risk score
- Action execution: Tier 3 triggers mitigation + case creation
Configuration reference
SONAR scenario YAML (shipping section)
shipping:
  enabled: true  # Enable shipping to RADAR
  scenario_id: "my_scenario"  # Scenario identifier for ar.yaml
  index_pattern: "sonar-anomalies"  # Target index pattern
  ship_all: false  # If false, only ship is_anomaly=true
  severity_threshold: "low"  # Minimum severity (low/medium/high)
  batch_size: 100  # Bulk indexing batch size
  flush_interval_seconds: 30  # Max time between flushes
Environment variables (.env)
SONAR shipping requires OpenSearch credentials:
# Same credentials as RADAR detector/monitor
OS_URL=https://wazuh-indexer.example.com:9200
OS_USER=admin
OS_PASS=SecurePassword123
OS_VERIFY_SSL=true
Deployment workflow
1. Deploy RADAR scenario
# Deploy RADAR with SONAR-integrated scenario
./build-radar.sh sonar_high_risk --agent remote --manager remote --manager_exists true
This deploys:
- SONAR decoder (100-sonar-decoder.xml)
- SONAR rules (100-sonar-rules.xml)
- Active response configuration (ar.yaml with sonar_high_risk)
2. Configure SONAR scenario
Create sonar/scenarios/high_risk.yaml with:
- Detection parameters (features, thresholds)
- Shipping configuration (enabled, scenario_id matching ar.yaml)
3. Run SONAR detection
# Continuous detection with shipping
sonar detect --scenario sonar/scenarios/high_risk.yaml --mode realtime
4. Verify integration
Check SONAR shipped anomalies:
curl -X GET "https://wazuh-indexer:9200/sonar-anomalies/_search?pretty" \
  -u admin:password \
  -H 'Content-Type: application/json' \
  -d '{
    "query": {"match_all": {}},
    "size": 10,
    "sort": [{"@timestamp": "desc"}]
  }'
Check Wazuh alerts:
# Check for rule 100410 triggers
curl -X GET "https://wazuh-indexer:9200/wazuh-alerts-*/_search?pretty" \
  -u admin:password \
  -H 'Content-Type: application/json' \
  -d '{
    "query": {"term": {"rule.id": "100410"}},
    "size": 5
  }'
Check active responses:
# Check RADAR AR logs
tail -f /var/ossec/logs/active-responses.log | grep sonar_high_risk
Implementation references
Primary implementations:
- Anomaly document creation: sonar/pipeline.py
- Shipper module: sonar/shipper/shipper.py
- CLI integration: sonar/cli.py
Configuration examples:
- SONAR scenario with shipping: sonar/scenarios/
- RADAR active response: radar/scenarios/active_responses/ar.yaml
- Wazuh decoders/rules: deployment/wazuh/
Best practices
- Scenario ID consistency: Use same
scenario_idin SONAR shipping config and ar.yaml - Severity filtering: Set appropriate
severity_thresholdto avoid overwhelming RADAR - Batch optimization: Tune
batch_sizeandflush_interval_secondsfor performance - Index lifecycle: Configure ILM policy for sonar-anomalies index to manage retention
- Monitoring: Track shipping metrics (success/failed documents)
- Testing: Validate integration with synthetic anomalies before production
- Correlation windows: Set
delta_ad_minutesin ar.yaml to match SONAR detection interval
Parent links: LARC-026 RADAR active response decision pipeline, LARC-027 RADAR data ingestion pipeline
3.7 RADAR-DECIPHER FlowIntel integration design SWD-038
This document specifies the design for integrating RADAR's active response system with the SATRAP-DL DECIPHER subsystem for automated FlowIntel incident case creation and CTI enrichment.
Integration architecture

DECIPHER client module
Implementation: radar/scenarios/active_responses/radar_ar.py (DecipherClient class)
API contract
DecipherClient
Constructor:
def __init__(self, base_url: str, verify_ssl: bool = False, timeout_sec: int = 30)
- Initializes HTTP session
- Configures SSL verification and timeout
Primary interfaces:
def health_check(self) -> bool:
Returns True if DECIPHER is reachable, False otherwise. Called before any incident operation.
def create_incident(self, decision: dict) -> dict | None:
Creates a FlowIntel incident case via DECIPHER. Returns result dict with case_id and case_url, or None on failure.
Incident endpoints (per scenario):
INCIDENT_ENDPOINTS = {
    "suspicious_login": "/api/v0.1/incident/suspicious_login",
    "geoip_detection":  "/api/v0.1/incident/geoip_detection",
    "log_volume":       "/api/v0.1/incident/log_volume",
}
Exception handling: Failures are caught and logged; active response execution continues regardless.
Integration with radar_ar.py
Implementation: radar/scenarios/active_responses/radar_ar.py
Incident creation workflow
Incident creation is triggered in RadarActiveResponse.run() after risk calculation, gated on two conditions:
- DECIPHER health check passes (
DecipherClient.health_check()returnsTrue) - Computed tier >= 1
if self.decipher.health_check() and risk["tier"] >= 1:
    incident = self.decipher.create_incident(decision)
    decision["incident"] = incident
This means every alert that clears Tier 0 automatically gets a FlowIntel case -- no per-scenario flag needed.
Configuration
No scenario-level flag controls case creation. The only relevant configuration is the DECIPHER connection in the environment file.
Environment variables (.env):
# DECIPHER configuration
DECIPHER_BASE_URL=https://decipher.example.com
DECIPHER_VERIFY_SSL=false
DECIPHER_TIMEOUT_SEC=30
Incident creation workflow

Incident payload
The create_incident() method builds the payload from the decision dict, including scenario name, risk score, tier, IOCs, and decision ID.
Response from DECIPHER API
{
  "case_id": 12345,
  "case_url": "http://flowintel.example.com/case/12345",
  "status": "open"
}
The case_url is included in the email notification sent to the SOC.
Error handling
| Error Type | Handling Strategy |
|---|---|
| DECIPHER unreachable | health_check returns False, skip incident creation, log warning, continue |
| Missing DECIPHER_BASE_URL | health_check returns False, skip silently |
| API errors | Log error with details, return None, continue active response |
| Timeout | Log timeout error, abort incident creation, continue active response |
| Unknown scenario | Log warning (no endpoint mapping), return None, continue |
Design principle: Active response execution must never be blocked by DECIPHER failures.
Best practices
- Tier 1 and above: Cases are created for all non-trivial alerts (tier >= 1), giving analysts visibility at every response level
- Health check first: Always verify DECIPHER reachability before attempting incident creation
- Per-scenario endpoints: Each scenario maps to its own DECIPHER incident endpoint for correct case template
- Error resilience: Never block email or mitigation execution on DECIPHER failures
- Audit trail: Log all incident creation attempts (success and failure) with case IDs and URLs
Parent links: LARC-026 RADAR active response decision pipeline
3.8 RADAR Ansible role architecture SWD-031
This document specifies the architecture and implementation of RADAR's Ansible automation framework used for deploying anomaly detection scenarios across Wazuh infrastructure.
Architecture overview
The RADAR deployment pipeline uses Ansible to orchestrate configuration across multiple deployment modes:
- Local development: Docker Compose managed Wazuh manager and agents
- Remote deployment: SSH-based configuration of existing infrastructure
- Hybrid deployment: Mixed local/remote configurations
Component hierarchy

Build script architecture (build-radar.sh)
Command-line interface
build-radar.sh <scenario> --agent <local|remote> --manager <local|remote> \
  --manager_exists <true|false> [--ssh-key </path/to/key>]
Deployment modes
| Mode | Manager | Agent | Manager Exists | Use Case |
|---|---|---|---|---|
| Lab development | local | local | false | Local Docker Compose testing |
| Existing deployment | remote | remote | true | Add scenario to running cluster |
| New deployment | remote | remote | false | Bootstrap Wazuh then configure |
| Hybrid | local | remote | false | Local manager with remote agents |
Workflow stages

Volume-first architecture
RADAR uses a volume-first approach: instead of executing commands inside containers, it directly manipulates configuration files on the host filesystem via Docker bind mounts.
Volume resolution workflow
- Load volumes.yml: Parse Docker Compose volume configuration
- Extract bind mounts: Identify container → host path mappings
- Derive host paths: Calculate actual file locations on host
- Direct manipulation: Write/modify files directly on host
Example volume mappings
# volumes.yml
services:
  wazuh.manager:
    volumes:
      - /radar-srv/wazuh/manager/etc:/var/ossec/etc
      - /radar-srv/wazuh/manager/active-response/bin:/var/ossec/active-response/bin
      - /radar-srv/wazuh/manager/filebeat/etc:/etc/filebeat
Resolved paths:
- Container:
/var/ossec/etc/ossec.conf→ Host:/radar-srv/wazuh/manager/etc/ossec.conf - Container:
/var/ossec/active-response/bin/radar_ar.py→ Host:/radar-srv/wazuh/manager/active-response/bin/radar_ar.py
Benefits
- Idempotency: Direct file manipulation with checksums
- Performance: No
docker execoverhead - Debugging: Configuration files directly accessible on host
- Reliability: Avoids container restart race conditions
Ansible role: wazuh_manager
Task breakdown

Key tasks
responses.yml
- Copy
radar_ar.pyto/var/ossec/active-response/bin/ - Copy
ar.yamlconfiguration - Set executable permissions (750)
- Generate
active_responses.envfrom environment variables
decoders.yml
- Copy scenario-specific XML decoders to
/var/ossec/etc/decoders/ - Use marker-based insertion:
<!-- BEGIN RADAR {scenario} -->/<!-- END RADAR {scenario} --> - Set ownership:
root:wazuh, permissions:640 - Verify XML syntax
rules.yml
- Copy scenario-specific XML rules to
/var/ossec/etc/rules/ - Marker-based idempotent insertion
- Ensure unique rule IDs (e.g., 100900-100999 for GeoIP)
ossec.yml
- Inject localfile, command, and active_response blocks into
/var/ossec/etc/ossec.conf - Marker-based to prevent duplicates
- Configure log monitoring paths and intervals
lists.yml
- Copy whitelist files (e.g.,
whitelist_countries) to/var/ossec/etc/lists/ - Update list references in rules
filebeat.yml
- Configure ingest pipelines for data enrichment (if applicable)
- Set up index templates
agent_config.yml
- Inject agent-specific configuration snippets
- Target specific agent groups
- Configure centralised agent configuration in
/var/ossec/etc/shared/{group}/agent.conf
bootstrap.yml (remote only, if manager_bootstrap == true)
- Install Wazuh Manager packages
- Configure initial settings
- Start services
Idempotency mechanisms
Marker-based insertion:
<!-- BEGIN RADAR geoip_detection -->
<decoder name="radar_geoip">
  ...
</decoder>
<!-- END RADAR geoip_detection -->
Ansible module: blockinfile with marker parameter
Checksums: Compare file content before copying to avoid unnecessary restarts
Ansible role: wazuh_agent
Task breakdown

Key tasks
-
RADAR Helper deployment (geoip_detection, suspicious_login scenarios):
- Copy
/opt/radar/radar-helper.pyto agent - Install
maxminddbPython package - Copy GeoLite2-City.mmdb and GeoLite2-ASN.mmdb to
/usr/share/GeoIP/ - Deploy systemd service file
- Enable and start service
- Copy
-
Agent registration:
- Extract manager IP from inventory
- Run
agent-authwith authentication token - Verify registration success
Inventory structure (inventory.yaml)
all:
  children:
    wazuh_manager_local:
      hosts:
        localhost:
          ansible_connection: local
          manager_mode: docker_local
          manager_container_name: wazuh.manager

    wazuh_manager_ssh:
      hosts:
        wazuh-manager.example.com:
          ansible_connection: ssh
          ansible_user: admin
          manager_mode: ssh

    wazuh_agents_container:
      hosts:
        localhost:
          ansible_connection: local
          agent_mode: docker_local

    wazuh_agents_ssh:
      hosts:
        agent-01.example.com:
          ansible_connection: ssh
          ansible_user: ubuntu
          agent_mode: ssh
        agent-02.example.com:
          ansible_connection: ssh
          ansible_user: ubuntu
          agent_mode: ssh
Host variables
| Variable | Purpose | Example |
|---|---|---|
manager_mode |
Deployment mode for manager | docker_local, ssh |
agent_mode |
Deployment mode for agent | docker_local, ssh |
manager_container_name |
Docker container name (local only) | wazuh.manager |
ansible_connection |
Ansible connection type | local, ssh |
ansible_user |
SSH username (SSH only) | admin, ubuntu |
Scenario configuration structure
Each scenario provides configuration artifacts in scenarios/:
scenarios/
├── decoders/
│   └── {scenario}/
│       └── *.xml
├── rules/
│   └── {scenario}/
│       └── *.xml
├── ossec/
│   └── radar-{scenario}-ossec-snippet.xml
├── active_responses/
│   ├── radar_ar.py (shared)
│   └── ar.yaml (shared)
├── lists/
│   └── whitelist_countries
├── pipelines/
│   └── {scenario}/
│       └── radar-pipeline.txt
├── agent_configs/
│   └── {scenario}/
│       └── radar-{scenario}-agent-snippet.xml
└── ingest_scripts/
    └── {scenario}/
        └── wazuh_ingest.py
Execution flow summary
- build-radar.sh parses arguments and validates scenario
- Bootstrap (if needed): Start local Docker containers or bootstrap remote manager
- Ansible playbook: Execute
site.yamlwith scenario-specific variables - Manager configuration: Apply decoders, rules, OSSEC snippets, active responses
- Agent configuration: Deploy RADAR Helper (if geographic scenario)
- Service restarts: Restart Wazuh Manager and agents to apply changes
Error handling and validation
- Pre-flight checks: Verify SSH keys exist for remote deployments
- Container health checks: Retry Docker container status checks with delays
- Bind mount validation: Assert required volume mappings exist in volumes.yml
- XML syntax validation: Check decoder/rule XML before injection
- Marker verification: Ensure markers don't conflict with existing configuration
- Restart coordination: Wait for service startup before proceeding
Security considerations
- Ansible Vault: Sensitive variables encrypted with
--ask-vault-pass - SSH key management: ssh-agent used for remote authentication
- File permissions: Active responses set to 750, configs to 640
- Ownership: Files owned by
root:wazuhto prevent tampering
Parent links: LARC-024 RADAR Ansible deployment pipeline flow
3.9 RADAR health check software design SWD-040
This document specifies the design of the RADAR deployment health check tool, covering the entry-point script, the Ansible playbook structure, and the two task files that implement manager and agent checks.
Purpose
The health check validates that a RADAR deployment is complete and operational after build-radar.sh has run. It reads state from the target environment without modifying it and produces a consolidated summary report.
Module inventory
| Module | Type | Responsibility |
|---|---|---|
health-radar.sh |
Bash script | Entry point, argument parsing, summary display |
health-check.yml |
Ansible playbook | Two-play orchestrator (manager + agents) |
tasks/main.yml |
Ansible tasks | Manager play init, scenario resolution, summary file writer |
tasks/check_manager.yml |
Ansible tasks | Seven manager check groups |
tasks/check_agents.yml |
Ansible tasks | Four agent check groups + per-agent summary file writer |
Component structure
health-radar.sh
  │
  ├── ansible-playbook health-check.yml
  │     │
  │     ├── Play 1: RADAR Health Check - Manager
  │     │     └── tasks/main.yml
  │     │           ├── init (vars, exec prefix, scenario list)
  │     │           ├── import check_manager.yml
  │     │           └── write /tmp/radar_health_<ts>.txt  [delegate_to: localhost]
  │     │
  │     └── Play 2: RADAR Health Check - Agents
  │           └── tasks/check_agents.yml
  │                 ├── 4 check groups (shell tasks)
  │                 └── write /tmp/radar_health_<ts>_agent_<host>.txt  [delegate_to: localhost]
  │
  └── (after ansible-playbook exits)
        cat /tmp/radar_health_<ts>.txt
        cat /tmp/radar_health_<ts>_agent_*.txt
Entrypoint (health-radar.sh)
Responsibilities
- Parse and validate
--manager,--agent,--scenario, and--ssh-keyarguments. - Invoke
ansible-playbook health-check.ymlwith resolved extra-vars includingsummary_file. - After the playbook exits, concatenate and print the manager summary file and all per-agent summary files to stdout.
Argument specification
| Argument | Required | Values | Default |
|---|---|---|---|
--manager |
Yes | local, remote |
— |
--agent |
Yes | local, remote |
— |
--scenario |
No | suspicious_login, geoip_detection, log_volume, all |
all |
--ssh-key |
No | path | ~/.ssh/id_ed25519 |
Manager mode mapping
--manager value |
manager_mode extra-var |
Exec prefix in tasks |
|---|---|---|
local |
docker_local |
docker exec wazuh.manager |
remote |
docker_remote |
docker exec wazuh.manager (on remote host via SSH) |
remote |
host_remote |
(empty — direct shell) |
Execution flow

Check coverage
Manager checks
| Check group | What is verified |
|---|---|
| Containers / service | wazuh.manager and ad-webhook containers running; Wazuh service active processes (host_remote mode) |
| Key files | Presence and wazuh group ownership of radar_ar.py, ar.yaml, active_responses.env, ossec.conf, agent.conf |
| Decoders and rules | Per-scenario decoder and rule files present under /var/ossec/etc/; wazuh group ownership |
| Python dependencies | python3, pyyaml, requests available in the manager execution environment |
| Connectivity | OpenSearch cluster health; Wazuh API authentication; Webhook endpoint reachable |
| log_volume specific | Filebeat archives pipeline contains log_volume_metric routing patch; radar-log-volume index template present in OpenSearch |
| geoip_detection specific | whitelist_countries list file present with wazuh group ownership |
Agent checks
| Check group | What is verified |
|---|---|
| Wazuh agent service | wazuh-agentd process running |
| RADAR helper | radar-helper.py present; radar-helper.service active; maxminddb importable in /opt/radar/venv |
| GeoIP databases | GeoLite2-City.mmdb and GeoLite2-ASN.mmdb present under /usr/share/GeoIP/ |
| AR scripts | At least one .sh active response script in /var/ossec/active-response/bin/ |
Summary report
Summaries are written to timestamped files on the controller during playbook execution and printed by health-radar.sh after ansible-playbook exits, making the consolidated report the last visible output regardless of how many agents are checked. Each block shows only FAIL and WARN lines in the body; OK items are counted in the footer only.
Parent links: MRS-002 Command & Control
4.0 ADBox v1 Software Design (Maintenance)
Software design specifications for ADBox v1 (MTAD-GAT legacy system) - maintenance mode only.
4.1 ADBox training pipeline SWD-001
The diagram depicts the sequence of operations of the training pipeline, orchestrated by the ADBox Engine.

Parent links: LARC-001 ADBox training pipeline flow
4.2 ADBox prediction pipeline SWD-002
The diagram depicts the sequence of operations in the prediction pipeline, orchestrated by the ADBox Engine.

Parent links: LARC-002 ADBox historical data prediction pipeline flow, LARC-008 ADBox batch and real-time prediction flow
4.3 MTAD-GAT training SWD-003
The diagram depicts the sequence of operations run by the function train_MTAD_GAT of the MTAD_GAT ML-subpackage of ADBox.

Parent links: LARC-009 ADBox machine learning package
4.4 MTAD-GAT prediction SWD-004
MTAD GAT prediction sequence diagram
The diagram depicts the sequence of operations run by the function predict_MTAD_GAT of the MTAD_GAT ML-subpackage of ADBOX.

Parent links: LARC-009 ADBox machine learning package
4.5 Peak-over-threshold (POT) SWD-005
POT evaluation sequence diagram
The diagram depicts the sequence of operations run by the function pot_eval of the MTAD_GAT subpackage of ADBox.
This function runs the dynamic POT (i.e., peak-over-threshold) evaluation.

Parent links: LARC-009 ADBox machine learning package
4.6 ADBox Predictor score computation SWD-006
Predictor score computation sequence diagram
The diagram depicts the sequence of operations run by the function get_score method of the Predictor class in the MTAD GAT PyTorch subpackage of ADBox.

Parent links: LARC-009 ADBox machine learning package
4.7 ADBox MTAD-GAT anomaly prediction SWD-007
ADBox MTAD GAT anomaly prediction sequence diagram
The diagram depicts the sequence of operations run by the function predict_anomalies method of the Predictor class in the MTAD GAT PyTorch subpackage of ADBox.

Parent links: LARC-009 ADBox machine learning package
4.8 ADBox MTAD-GAT Predictor SWD-008
ADBox MTAD GAT Predictor class diagram
The diagram below depicts the Predictor class of the MTAD GAT PyTorch subpackage of ADBox.

Parent links: LARC-009 ADBox machine learning package
4.9 ADBox data managers SWD-009
ADBox data manager class diagrams
The diagram below depicts the Data manager classes of ADBox, all designed and implemented as Singleton classes.

Parent links: LARC-010 ADBox data manager
4.10 ADBox data transformer SWD-010
ADBox data transformer class diagram
The diagram below depicts the Data Transformer class of ADBox.

Parent links: LARC-003 ADBox preprocessing flow
4.11 ADBox preprocessing SWD-011
ADBox preprocessing sequence diagram
The diagram summarizes the sequence of actions of the method Preprocessor.preprocessing in the ADBox DataTransformer.

Parent links: LARC-003 ADBox preprocessing flow
4.12 ADBox TimeManager SWD-012
ADBox time manager class diagrams
The diagram below depicts the Time manager classes of ADBox.
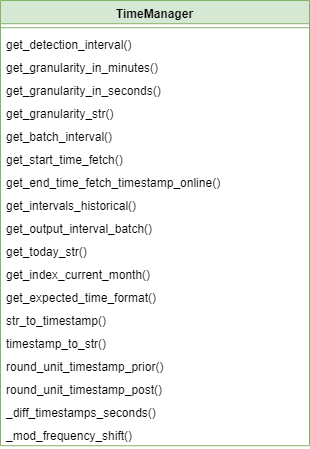
Parent links: LARC-011 ADBox TimeManager
4.13 ADBox Prediction pipeline's inner body SWD-013
Prediction pipeline sequence diagram
The diagram depicts the sequence of operations in the prediction pipeline body (private method), called by the prediction pipeline.
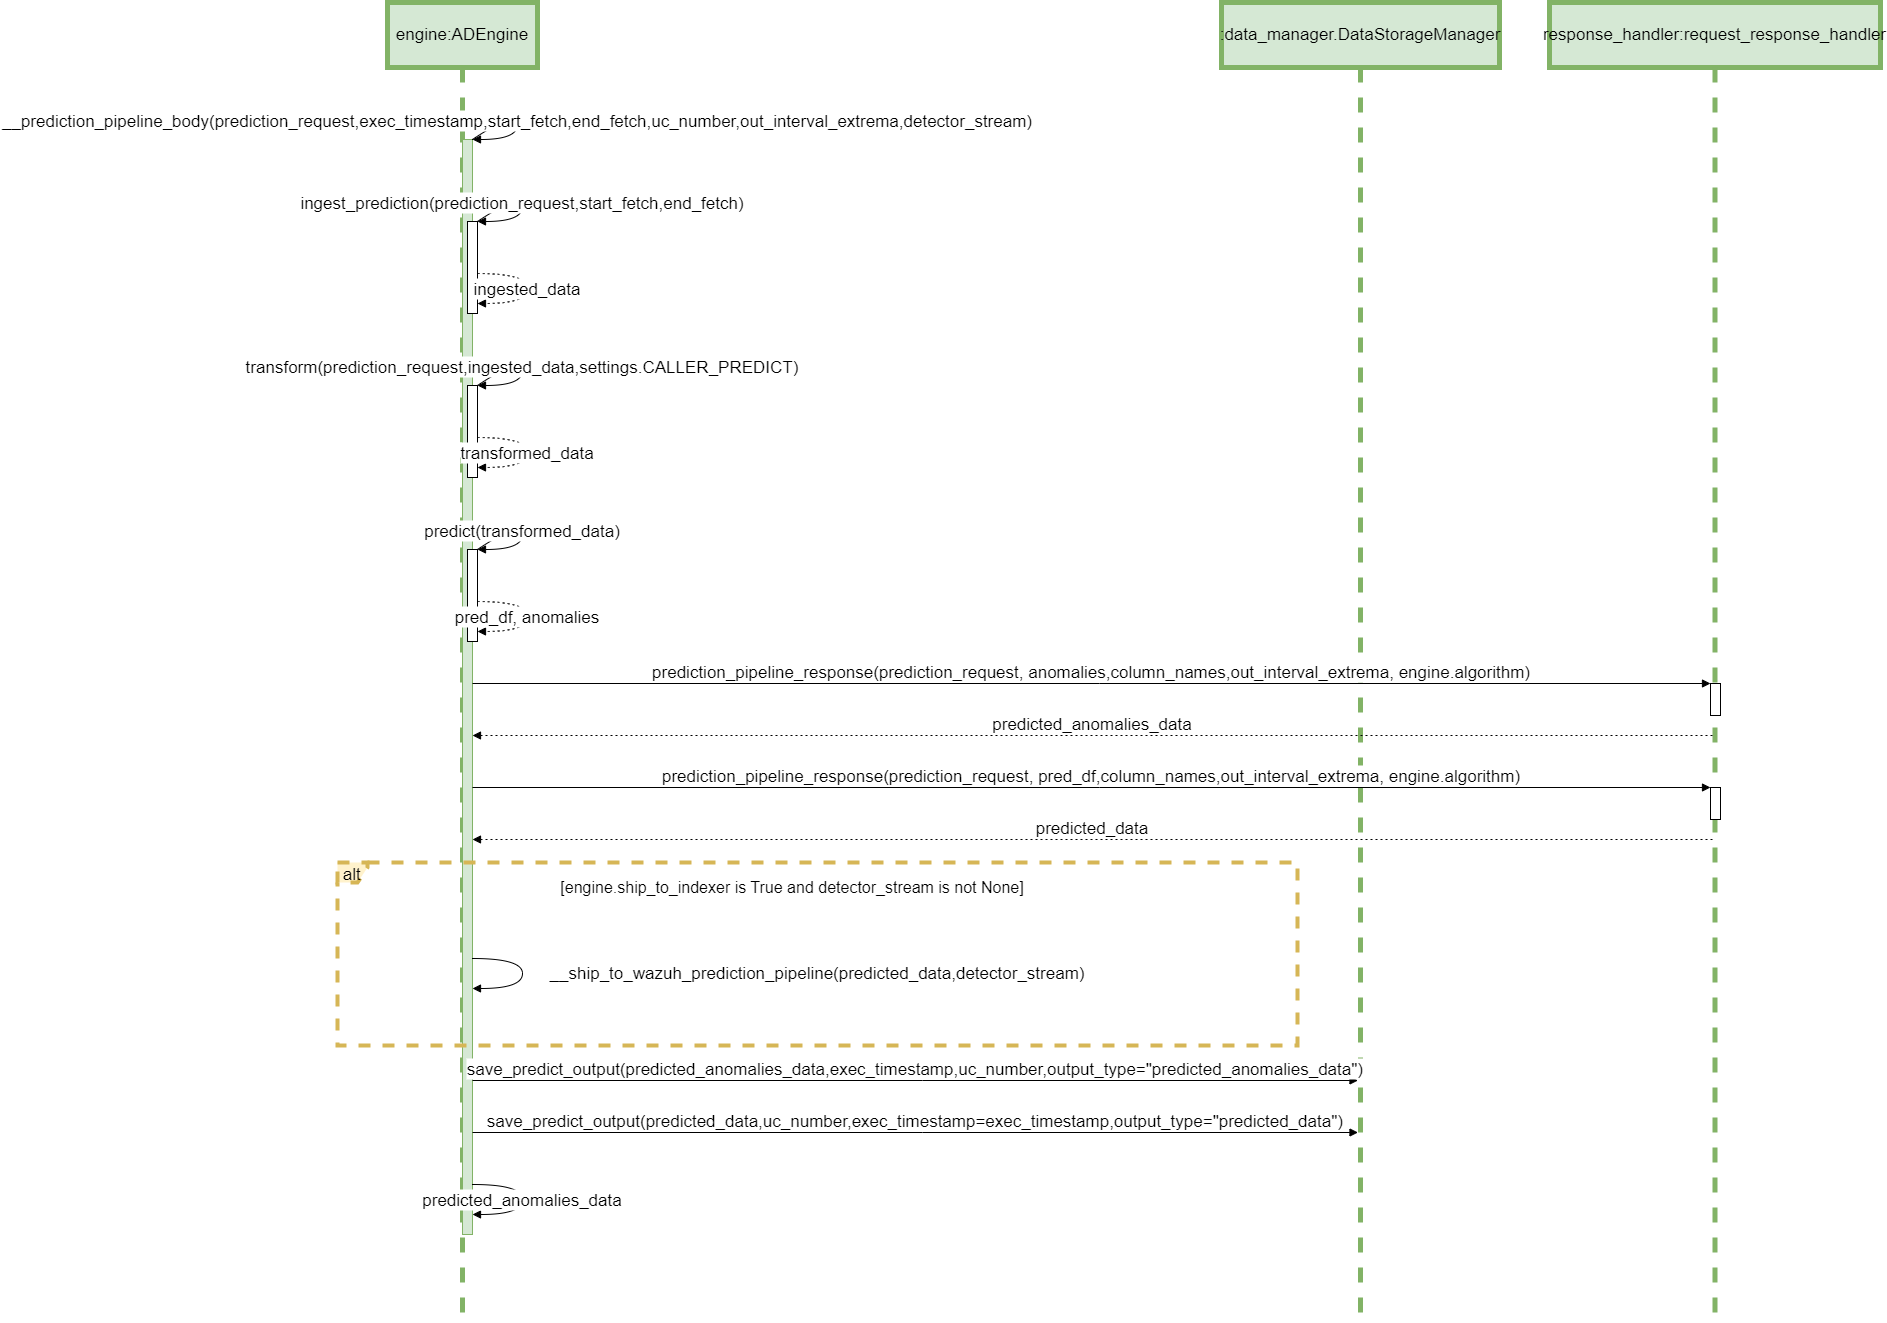
Parent links: LARC-002 ADBox historical data prediction pipeline flow, LARC-008 ADBox batch and real-time prediction flow
4.14 ADBox config managers SWD-014
ADBox config manager class diagrams
The diagram below depicts the Config manager classes of ADBox.

Parent links: LARC-012 ADBox ConfigManager
4.15 ADBox Shipper and Template Handler SWD-015
ADBox Shipper and Template Handler class diagrams
The diagram below depicts the DataShipper,WazuhDataShipper and TamplateHandler classes of ADBox.

Parent links: LARC-014 ADBox Shipper
4.16 ADBox shipping of prediction data SWD-016
Sequence diagram of ADBox shipping of prediction data
The diagram below depicts the sequence of actions orchestrated by the ADBox Engine when shipping is enabled within the prediction pipeline.

Parent links: LARC-014 ADBox Shipper
4.17 ADBox creation of a detector stream SWD-017
Sequence diagram of ADBox creation of a detector stream
The diagram below depicts the sequence of actions orchestrated by the ADBox Engine when shipping is enabled within the training pipeline.
Specifically, the __ship_to_wazuh_training_pipeline method which
- creates a detector data stream amd the correspondig templates.
- and can ship the test and training data predictions.

Parent links: LARC-014 ADBox Shipper