1.0 ADBox test case specifications
1.1 Deploy ADBox via Docker and shell scripts TST-001
Preconditions and setup actions
- Docker version 26.0.0
- User with root privileges
- 26 GB storage on the machine
- git version 2.44.0
Test steps
-
Clone the ADBox repository.
git clone https://github.com/AbstractionsLab/idps-escape.git -
Change the working directory to the cloned folder containing all the files along with the Dockerfile.
cd siem-mtad-gat
- Build the image.
3a. Make the script executable: chmod +x build-adbox.sh
3b. And execute it as follows
./build-adbox.sh
- Run the container by executing the bash file containing the run commands.
4a. Make it executable: chmod +x adbox.sh
4b. And execute it as follows
./adbox.sh -h
Expected outcome
Step 1. A copy of siem-mtad-gat folder in local folder
Step 3. In the list of docker images (docker images), the following should be present
REPOSITORY                      TAG       IMAGE ID       CREATED         SIZE
siem-mtad-gat                   v0.1.4    ...   ...            ...
Step 4b. Display ADBox help message
usage: driver.py [-h] [-i] [-u USECASE] [-c] [-s]

IDPS-ESCAPE ADBox, an open-source anomaly detection toolbox, developed in project CyFORT.

options:
  -h, --help            show this help message and exit
  -i, --interactive     run the interactive console for training and prediction
  -u USECASE, --usecase USECASE
                        specify a configuration scenario/use-case file for training and prediction
  -c, --connection      check connection with Wazuh
  -s, --shipping        enable data shipping to Wazuh
Parent links: SRS-046 Cross-Platform ADBox Deployment
Child links: TRA-001, TRB-002 TCER: ADBox deployment
| Attribute | Value |
|---|---|
| platform | Ubuntu 22.04.4 LTS |
| execution_type | M |
| verification_method | T |
| release | alpha |
| complexity | 1 |
| test_data | see referenced files |
| version | 0.2 |
1.3 Install ADBox as dev container TST-003
Preconditions and setup actions
- Docker engine version 26.1.3
- Docker desktop version 1.0.35
- Visual Studio Code version 1.83.1 (system setup)
- Dev Containers extension for VS Code by Microsoft version v0.315.1
- at least 26 GB of persistent/disk storage
Test steps
- Clone this repository:
git clone https://github.com/AbstractionsLab/idps-escape.git - Start Docker Desktop if not already running.
- Open the project folder in VS Code.
- Select the "Reopen in Container" option in the notification that pops up in VS Code or run it via the command palette.
- Open a terminal in VS Code and run
poetry installin the container to install all dependencies. - Run ADBox using its entrypoint.
poetry run adbox
Expected outcome
Step 1. Repository creation
Step 4. Container created and terminal open.
Step 5. Poetry install terminated with Installing the current project: siem-mtad-gat (0.1.4).
Step 6. Run ADBox default mode:
  IDPS-ESCAPE ADBox running in default mode
Are you sure you wish to run the default ADBox in default mode? (y/n):
Parent links: SRS-044 Platform-Independent Deployment
Child links: TRB-003 TCER: ADBox in dev container, TRA-003, TRA-004, TRA-020
| Attribute | Value |
|---|---|
| platform | Ubuntu 22.04.4 LTS |
| execution_type | M |
| verification_method | T |
| release | alpha |
| complexity | 2 |
| test_data | see referenced files |
| version | 0.2 |
1.4 Run ADBox console TST-004
Preconditions and setup actions
- Docker version 26.0.0
- User with root privileges
- Built image
siem-mtad-gat:v0.1.4 - No existing container named
siem-mtad-gat-containershould be running.
Test steps
- Run the container “siem-mtad-gat-container” by executing the adbox script without any parameters.
./adbox.sh -i
Expected outcome
ADBox starts with
IDPS-ESCAPE ADBox driver running in interactive console mode.

Enter a number and press enter to select an ADBox action to perform:
1. Train an anomaly detector.
2. Predict anomalies using one of the available detectors.
3. Select an existing anomaly detector for prediction.
4. Exit
Enter a number (1-4):
Parent links: SRS-047 Interactive Use Case Builder
Child links: TRB-004 TCER: ADBox console, TRA-005
| Attribute | Value |
|---|---|
| platform | Ubuntu 22.04.4 LTS |
| execution_type | M |
| verification_method | T |
| release | alpha |
| complexity | 2 |
| test_data | see referenced files |
| version | 0.2 |
1.5 Run ADBox in default mode with a Wazuh connection TST-005
Preconditions and setup actions
- Docker version 26.0.0
- User with root privileges
- Built image
siem-mtad-gat:v0.1.4 - No existing container named
siem-mtad-gat-containershould be running. - An instance of a Wazuh distribution should be running.
- Wazuh indexer RESTful API should be listening on port 9200.
- TST-034 and TST-035 should succeed
Test steps
- Run the container “siem-mtad-gat-container” by executing the adbox script without any parameters.
./adbox.sh - Input
yafterAre you sure you wish to run the default ADBox in default mode? (y/n):
Expected outcome
- ADBox starts with
IDPS-ESCAPE ADBox running in default mode
Are you sure you wish to run the default ADBox in default mode? (y/n): y
No input use-case: a detection with default config will be created.
Start training pipeline.
Init Data managers.
JSON file 'detector_input_parameters.json' saved at /home/alab/siem-mtad-gat/siem_mtad_gat/assets/detector_models/{detector_id}/input/detector_input_parameters.json.
Data ingestion.
...
- A detector {detector_id} is trained according to the default parameters specified in
siem_mtad_gat/assets/default_configs/default_detector_input_config.json. - Training response should be seen in the console.
- Training outputs and artifacts should be available in the following folder:
/home/root/siem-mtad-gat/siem_mtad_gat/assets/detector_models/{detector_id}.
Parent links: SRS-048 Default Detector Training
Child links: TRB-005 TCER: ADBox in default mode with Wazuh, TRA-006
| Attribute | Value |
|---|---|
| platform | Ubuntu 22.04.4 LTS |
| execution_type | M |
| verification_method | T |
| release | alpha |
| complexity | 3 |
| test_data | see referenced files |
| version | 0.2 |
1.6 Run ADBox in default mode without a Wazuh connection TST-006
Preconditions and setup actions
- Docker version 26.0.0
- User with root privileges
- Built image
siem-mtad-gat:v0.1.0 - No existing container named
“siem-mtad-gat-container”should be running. - No instance of Wazuh distribution running.
Test steps
- Run the container “siem-mtad-gat-container” by executing the adbox script without any parameters.
./adbox.sh - Input
yafterAre you sure you wish to run the default ADBox in default mode? (y/n):
Expected outcome
- ADBox starts with
IDPS-ESCAPE ADBox running in default mode
Are you sure you wish to run the default ADBox in default mode? (y/n): y
No input use-case: a detection with default config will be created.
Start training pipeline.
Init Data managers.
JSON file 'detector_input_parameters.json' saved at /home/alab/siem-mtad-gat/siem_mtad_gat/assets/detector_models/fb5faf1c-7913-4e90-880f-51f3a178a053/input/detector_input_parameters.json.
Data ingestion.
Wazuh data ingestor establishing connection to Wazuh...
Could not establish a connection with OpenSearch.
More details see logs.
...
- A detector {detector_id} is trained according to the default parameters specified in
siem_mtad_gat/assets/default_configs/default_detector_input_config.jsonand using default stored data
...
The file '/home/alab/siem-mtad-gat/siem_mtad_gat/assets/data/train/sample-alerts-train-2024-11.json' does not exist, returning all default data.
...
- Training response should be seen in the console.
- Training outputs and artifacts should be available in the
/home/root/siem-mtad-gat/siem_mtad_gat/assets/detector_models/{detector_id}folder.
Parent links: SRS-048 Default Detector Training
| Attribute | Value |
|---|---|
| platform | Ubuntu 22.04.4 LTS |
| execution_type | M |
| verification_method | T |
| release | alpha |
| complexity | 2 |
| test_data | see referenced files |
| version | 0.2 |
1.7 ADBox use case 1 with a Wazuh connection TST-007
Preconditions and setup actions
- Docker version 26.0.0
- User with root privileges
- Built image
siem-mtad-gat:v0.1.4 - No existing container named
siem-mtad-gat-containershould be running. - An instance of a Wazuh distribution should be running.
- Wazuh indexer RESTful API should be listening on port 9200.
- Wazuh configured to monitor linux resource utilization. (Monitoring Linux resource usage with Wazuh)
2024-07-*index not empty.- TST-034 and TST-035 should succeed
Test steps
- Run the container
siem-mtad-gat-containerby executing the adbox script with use case 1 parameters../adbox.sh -u 1
Expected outcome
- ADBox starts with
IDPS-ESCAPE ADBox driver running use-case scenario configuration uc_1.yaml. - The training should run for 10 epochs.
- Training response should be seen in the console.
- Training outputs and artifacts should be available in the
/home/root/siem-mtad-gat/siem_mtad_gat/assets/detector_models/{detector_id}folder. - Prediction starts after training with the message
Predicting in real-time mode with interval 1 (min). - A prediction response should be seen in the output console after every 1 minute.
- Prediction outputs and artifacts should be available in the
/home/root/siem-mtad-gat/siem_mtad_gat/assets/detector_models/{detector_id}/predictionfolder.
Parent links: SRS-027 ML-Based Anomaly Detection
Child links: TRA-008
| Attribute | Value |
|---|---|
| platform | Ubuntu 22.04.4 LTS |
| execution_type | M |
| verification_method | T |
| release | alpha |
| complexity | 2 |
| test_data | see referenced files |
| version | 0.2 |
1.8 ADBox use case 1 without a Wazuh connection TST-008
Preconditions and setup actions
- Docker version 26.0.0
- User with root privileges
- Built image
siem-mtad-gat:v0.1.4 - No existing container named
siem-mtad-gat-containershould be running. - No instance of Wazuh distribution running.
Test steps
- Run the container
siem-mtad-gat-containerby executing the adbox script with use case 1 parameters.
./adbox.sh -u 1
Expected outcome
- ADBox starts with
Running AD driver with user configuration uc_1.yaml. - Output screen should show the message
Could not establish a connection with OpenSearch. - And collect training data from the default file with message
Returning data from file /home/root/siem-mtad-gat/siem_mtad_gat/assets/data/train/sample-alerts-train-2024-07.json. - The training should run for 10 epochs.
- Training response should be seen in the console.
- Training outputs and artifacts should be available in the
/home/root/siem-mtad-gat/siem_mtad_gat/assets/detector_models/{detector_id}folder. - Prediction starts after training with message
Predicting in real-time mode with interval 1 (min). - Output screen should show the following messages:
Could not establish a connection with OpenSearch.Prediction in run_mode.REALTIME requires a connection with OpenSearch.No data found for given input.- And the application should exit.
Parent links: SRS-027 ML-Based Anomaly Detection
| Attribute | Value |
|---|---|
| platform | Ubuntu 22.04.4 LTS |
| execution_type | M |
| verification_method | T |
| release | alpha |
| complexity | 2 |
| test_data | see referenced files |
| version | 0.1 |
1.9 ADBox use case 2 with a Wazuh connection TST-009
Preconditions and setup actions
- Docker version 26.0.0
- User with root privileges
- Built image
siem-mtad-gat:v0.1.4 - No existing container named
siem-mtad-gat-containershould be running. - An instance of a Wazuh distribution should be running.
- Wazuh indexer RESTful API should be listening on port 9200.
2024-07-*index not empty.- TST-034 and TST-035 should succeed
Test steps
- Run the container
siem-mtad-gat-containerby executing the adbox script with use case 2 parameters../adbox.sh -u 2
Expected outcome
- ADBox starts with
Running AD driver with user configuration uc_2.yaml. - The training should run for 10 epochs.
- Training response should be seen in the console.
- Training outputs and artifacts should be available in the
/home/root/siem-mtad-gat/siem_mtad_gat/assets/detector_models/{detector_id}folder. - Prediction starts after training with message
Predicting in historical mode. - Prediction response should be seen in the output console.
- Prediction outputs and artifacts should be available in the
/home/root/siem-mtad-gat/siem_mtad_gat/assets/detector_models/{detector_id}/predictionfolder.
Parent links: SRS-035 Offline Anomaly Detection
Child links: TRB-006 TCER: ADBox UC scenario 2 with Wazuh, TRA-010
| Attribute | Value |
|---|---|
| platform | Ubuntu 22.04.4 LTS |
| execution_type | M |
| verification_method | T |
| release | alpha |
| complexity | 2 |
| test_data | see referenced files |
| version | 0.2 |
1.10 ADBox use case 2 without a Wazuh connection TST-010
Preconditions and setup actions
- Docker version 26.0.0
- User with root privileges
- Built image
siem-mtad-gat:v0.1.4 - No existing container named
siem-mtad-gat-containershould be running. - No instance of Wazuh distribution running.
Test steps
- Run the container
siem-mtad-gat-containerby executing the adbox script with use case 2 parameters../adbox.sh -u 2
Expected outcome
- ADBox starts with
Running AD driver with user configuration uc_2.yaml. - Output screen should show the message
Could not establish a connection with OpenSearch. - And collect training data from the default file with message
Returning data from file /home/root/siem-mtad-gat/siem_mtad_gat/assets/data/train/sample-alerts-train-2024-07. - The training should run for 10 epochs.
- Training response should be seen on the console.
- Training outputs and artifacts should be available in the
/home/root/siem-mtad-gat/siem_mtad_gat/assets/detector_models/{detector_id}folder. - Prediction starts after training with message
Predicting in historical mode. - Output screen should show message
Could not establish a connection with OpenSearch. - And collect training data from default file with message
The file '/home/root/siem-mtad-gat/siem_mtad_gat/assets/data/predict/sample-alerts-predict-2024-07-26' does not exist, returning all default data., depending upon the date it was run. - Prediction response should be seen in the output console.
- Prediction outputs and artifacts should be available in the
/home/root/siem-mtad-gat/siem_mtad_gat/assets/detector_models/{detector_id}/predictionfolder.
Parent links: SRS-035 Offline Anomaly Detection
Child links: TRA-017
| Attribute | Value |
|---|---|
| platform | Ubuntu 22.04.4 LTS |
| execution_type | M |
| verification_method | T |
| release | alpha |
| complexity | 2 |
| test_data | see referenced files |
| version | 0.2 |
1.11 ADBox use case 3 with a Wazuh connection TST-011
Preconditions and setup actions
- Docker version 26.0.0
- User with root privileges
- Built image
siem-mtad-gat:v0.1.4 - No existing container named
siem-mtad-gat-containershould be running. - An instance of a Wazuh distribution should be running.
- Wazuh indexer RESTful API should be listening on port 9200.
2024-07-*index not empty.- TST-034 and TST-035 should succeed
Test steps
- Run the container
siem-mtad-gat-containerby executing the adbox script with use case 3 parameters.
./adbox.sh -u 3
Expected outcome
- ADBox starts with
Running AD driver with user configuration uc_3.yaml. - The training should run for 10 epochs.
- Training response should be seen in the console.
- Training outputs and artifacts should be available in the
/home/root/siem-mtad-gat/siem_mtad_gat/assets/detector_models/{detector_id}folder. - Prediction starts after training with message
Predicting in batch mode with batch interval 5 (min). - Prediction response should be seen on the output console after every 5 minutes.
- Prediction outputs and artifacts should be available in the
/home/root/siem-mtad-gat/siem_mtad_gat/assets/detector_models/{detector_id}/predictionfolder.
Parent links: SRS-027 ML-Based Anomaly Detection
Child links: TRB-007 TCER: ADBox UC scenario 3 with Wazuh, TRA-011
| Attribute | Value |
|---|---|
| platform | Ubuntu 22.04.4 LTS |
| execution_type | M |
| verification_method | T |
| release | alpha |
| complexity | 2 |
| test_data | see referenced files |
| version | 0.2 |
1.12 ADBox use case 3 without a Wazuh connection TST-012
Preconditions and setup actions
- Docker version 26.0.0
- User with root privileges
- Built image
siem-mtad-gat:v0.1.4 - No existing container named
siem-mtad-gat-containershould be running. - No instance of Wazuh distribution running.
Test steps
- Run the container
siem-mtad-gat-containerby executing the adbox script with use case 3 parameters.
./adbox.sh -u 3
Expected outcome
- ADBox starts with
Running AD driver with user configuration uc_3.yaml. - Output screen should show the message
Could not establish a connection with OpenSearch. - And collect training data from the default file with the message
Returning data from file /home/root/siem-mtad-gat/siem_mtad_gat/assets/data/train/sample-alerts-train-2024-07.json. - The training should run for 10 epochs.
- Train response should be seen on the console.
- Training outputs and artifacts should be available in the
/home/root/siem-mtad-gat/siem_mtad_gat/assets/detector_models/{detector_id}folder. - Prediction starts after training with message
Predicting in batch mode with batch interval 5 (min). - Output screen should show the following messages:
Could not establish a connection with OpenSearch.Prediction in run_mode.BATCH requires a connection with OpenSearch.No data found for given input.- And the application should exit.
Parent links: SRS-027 ML-Based Anomaly Detection
Child links: TRA-016
| Attribute | Value |
|---|---|
| platform | Ubuntu 22.04.4 LTS |
| execution_type | M |
| verification_method | T |
| release | alpha |
| complexity | 2 |
| test_data | see referenced files |
| version | 0.1 |
1.13 ADBox use case 4 with a Wazuh connection TST-013
Preconditions and setup actions
- Docker version 26.0.0
- User with root privileges
- Built image
siem-mtad-gat:v0.1.0 - No existing container named
siem-mtad-gat-containershould be running. - An instance of a Wazuh distribution should be running.
- Wazuh indexer RESTful API should be listening on port 9200.
- Wazuh agent configured to read Suricata logs.
- "2024-03-*" not empty.
- TST-034 and TST-035 should succeed
Test steps
- Run the container
siem-mtad-gat-containerby executing the adbox script with use case 4 parameters.
./adbox.sh -u 4
Expected outcome
- ADBox starts with
Running AD driver with user configuration uc_4.yaml. - The training should run for 10 epochs.
- Training response should be seen in the console.
- Training outputs and artifacts should be available in the
/home/root/siem-mtad-gat/siem_mtad_gat/assets/detector_models/{detector_id}folder. - Prediction starts after training with message
Predicting in historical mode. - Prediction response should be seen in the output console.
- Prediction outputs and artifacts should be available in the
/home/root/siem-mtad-gat/siem_mtad_gat/assets/detector_models/{detector_id}/predictionfolder.
Parent links: SRS-038 Joint Host-Network Training
Child links: TRA-012
| Attribute | Value |
|---|---|
| platform | Ubuntu 22.04.4 LTS |
| execution_type | M |
| verification_method | T |
| release | alpha |
| complexity | 2 |
| test_data | see referenced files |
| version | 0.2 |
1.14 ADBox use case 4 without a Wazuh connection TST-014
Preconditions and setup actions
- Docker version 26.0.0
- User with root privileges
- Built image
siem-mtad-gat:v0.1.4 - No existing container named
siem-mtad-gat-containershould be running. - No instance of Wazuh distribution running.
Test steps
- Run the container
siem-mtad-gat-containerby executing the adbox script with use case 4 parameters.
./adbox.sh -u 4
Expected outcome
- ADBox starts with
Running AD driver with user configuration uc_4.yaml. - Output screen should show message
Could not establish a connection with OpenSearch. - And collect training data from default file with message
Returning data from file /home/root/siem-mtad-gat/siem_mtad_gat/assets/data/train/sample-alerts-train-2024-03.json. - The training should run for 10 epochs.
- Training response should be seen on the console.
- Training outputs and artifacts should be available in the
/home/root/siem-mtad-gat/siem_mtad_gat/assets/detector_models/{detector_id}folder. - Prediction starts after training with message
Predicting in historical mode. - Output screen should show message
Could not establish a connection with OpenSearch. - And collect training data from default file with message
The file '/home/root/siem-mtad-gat/siem_mtad_gat/assets/data/predict/wazuh-alerts-*.*-2024.07.22.json' does not exist, returning all default data., depending upon the date it was run. - Prediction response should be seen on the output console.
- Prediction outputs and artifacts should be available in the
/home/root/siem-mtad-gat/siem_mtad_gat/assets/detector_models/{detector_id}/predictionfolder.
Parent links: SRS-038 Joint Host-Network Training
Child links: TRA-015
| Attribute | Value |
|---|---|
| platform | Ubuntu 22.04.4 LTS |
| execution_type | M |
| verification_method | T |
| release | alpha |
| complexity | 2 |
| test_data | see referenced files |
| version | 0.2 |
1.15 ADBox use case 5 with a Wazuh connection TST-015
Preconditions and setup actions
- Docker version 26.0.0
- User with root privileges
- Built image
siem-mtad-gat:v0.1.4 - No existing container named
siem-mtad-gat-containershould be running. - An instance of a Wazuh distribution should be running.
- Wazuh indexer RESTful API should be listening on port 9200.
- Wazuh agent configured to read Suricata logs.
- TST-034 and TST-035 should succeed
Test steps
- Run the container
siem-mtad-gat-containerby executing the adbox script with use case 5 parameters../adbox.sh -u 5
Expected outcome
- ADBox starts with
Running AD driver with user configuration uc_5.yaml. - The training should run for 10 epochs.
- Training response should be seen in the console.
- Training outputs and artifacts should be available in the
/home/root/siem-mtad-gat/siem_mtad_gat/assets/detector_models/{detector_id}folder. - Prediction starts after training with message
Predicting in historical mode. - Prediction response should be seen on the output console.
- Prediction outputs and artifacts should be available in the
/home/root/siem-mtad-gat/siem_mtad_gat/assets/detector_models/{detector_id}/predictionfolder.
Parent links: SRS-037 Anomaly-Based NIDS
Child links: TRA-013
| Attribute | Value |
|---|---|
| platform | Ubuntu 22.04.4 LTS |
| execution_type | M |
| verification_method | T |
| release | alpha |
| complexity | 2 |
| test_data | see referenced files |
| version | 0.2 |
1.16 ADBox use case 5 without a Wazuh connection TST-016
Preconditions and setup actions
- Docker version 26.0.0
- User with root privileges
- Built image
siem-mtad-gat:v0.1.4 - No existing container named
siem-mtad-gat-containershould be running. - No instance of Wazuh distribution running.
Test steps
- Run the container
siem-mtad-gat-containerby executing the adbox script with use case 5 parameters.
./adbox.sh -u 5
Expected outcome
- ADBox starts with
Running AD driver with user configuration uc_5.yaml. - Output screen should show message
Could not establish a connection with OpenSearch. - And collect training data from default file with message
Returning data from file /home/root/siem-mtad-gat/siem_mtad_gat/assets/data/train/sample-alerts-train-2024-03.json. - The training should run for 10 epochs.
- Training response should be seen in the console.
- Training outputs and artifacts should be available in the
/home/root/siem-mtad-gat/siem_mtad_gat/assets/detector_models/{detector_id}folder. - Prediction starts after training with message
Predicting in historical mode. - Output screen should show message
Could not establish a connection with OpenSearch. - And collect training data from default file with message
The file '/home/root/siem-mtad-gat/siem_mtad_gat/assets/data/predict/wazuh-alerts-*.*-2024.07.22.json' does not exist, returning all default data., depending upon the date it was run. - Prediction response should be seen in the output console.
- Prediction outputs and artifacts should be available in the
/home/root/siem-mtad-gat/siem_mtad_gat/assets/detector_models/{detector_id}/predictionfolder.
Parent links: SRS-037 Anomaly-Based NIDS
Child links: TRA-014
| Attribute | Value |
|---|---|
| platform | Ubuntu 22.04.4 LTS |
| execution_type | M |
| verification_method | T |
| release | alpha |
| complexity | 2 |
| test_data | see referenced files |
| version | 0.2 |
1.17 ADBox shipping install TST-017
Preconditions and setup actions
- Docker version 26.0.0
- User with root privileges
- Built image
siem-mtad-gat:v0.1.4 - No existing container named
siem-mtad-gat-containershould be running. - An instance of a Wazuh distribution should be running.
Test steps
- Run the container
siem-mtad-gat-containerby executing the adbox script with shipping flag.
./adbox.sh -s
Expected outcome
CLI:
IDPS-ESCAPE ADBox shipping on
ADBox Shipper establishing connection to Wazuh...
ADBox shipper connected to Wazuh
Template for mtad_gat initialized
Exit shipper installation. Check ADBox templates and policy correct installation from Wazuh Dashboard!
Wazuh Dashboard* :
- Indexer Management>Index Management>Templates check for presence of base templates
adbox_stream_template,adbox_stream_template_mtad_gat; - Indexer Management>Index Management>Templates>Component templates check for presence of base templates
component_template_mtad_gat; - Indexer Management>Index Management>State management policies check for presence of the policy
adbox_detectors_rollover.
Parent links: SRS-049 Anomaly Shipping to Indexer
Child links: TRB-001 TCER: install ADBox shipping
| Attribute | Value |
|---|---|
| platform | Ubuntu 22.04.4 LTS |
| execution_type | M |
| verification_method | I |
| release | alpha |
| complexity | 2 |
| test_data | see referenced files |
| version | 0.2 |
1.18 ADBox Create detector data stream TST-018
Preconditions and setup actions
- Docker version 26.0.0
- User with root privileges
- Built image
siem-mtad-gat:v0.1.4 - No existing container named
siem-mtad-gat-containershould be running. - An instance of a Wazuh distribution should be running.
Test steps
- Run the container
siem-mtad-gat-containerby executing the adbox use case 12 with shipping flag.
./adbox.sh -u 12 -s
Expected outcome
CLI:
- Training model for 2 epochs
  IDPS-ESCAPE ADBox shipping on
  ADBox Shipper establishing connection to Wazuh...
  IDPS-ESCAPE ADBox driver running use case scenario configuration uc_12.yaml.
  Start training pipeline.
  Init Data managers.
  JSON file 'detector_input_parameters.json' saved at /home/root/siem-mtad-gat/siem_mtad_gat/assets/detector_models/1bda6dd3-0947-43e3-9ca2-bd3c711ae69f/input/detector_input_parameters.json.
  Data ingestion.
  Wazuh data ingestor establishing connection to Wazuh...
- Historical prediction: the start time shall be the present day at '00:06:00Z' (notice window size is 6 and granularity 1min) and the end time/present timestamp rounded to the closest unit timestamp.
Start prediction pipeline. Detector: 1bda6dd3-0947-43e3-9ca2-bd3c711ae69f
Init Data managers.
Spot object 0 loaded.
Spot object 1 loaded.
...
Prediction response:
{'run_mode': 'HISTORICAL', 'detector_id': '1bda6dd3-0947-43e3-9ca2-bd3c711ae69f', 'start_time': '2024-11-25T00:06:00Z', 'end_time': '2024-11-25T16:58:00Z', 'results': []}
Prediction ended
Local storage:
- Training outputs and artifacts available in the
/home/root/siem-mtad-gat/siem_mtad_gat/assets/detector_models/{detector_id}folder.
Wazuh Dashboard:
- When verifying the output using the dashboard vizualisations, remember that time shift due to TimeZone may apply.
- Indexer Management>Index Management>Templates check if the template
adbox_detector_mtad_gat_{detector_id}is there; - Indexer Management>Index Management>Templates> Component templates check if the templates
component_template_{detector_id}is there; - Indexer Management>Data streams check if
adbox_detector_mtad_gat_{detector_id}is there and contains at least a document.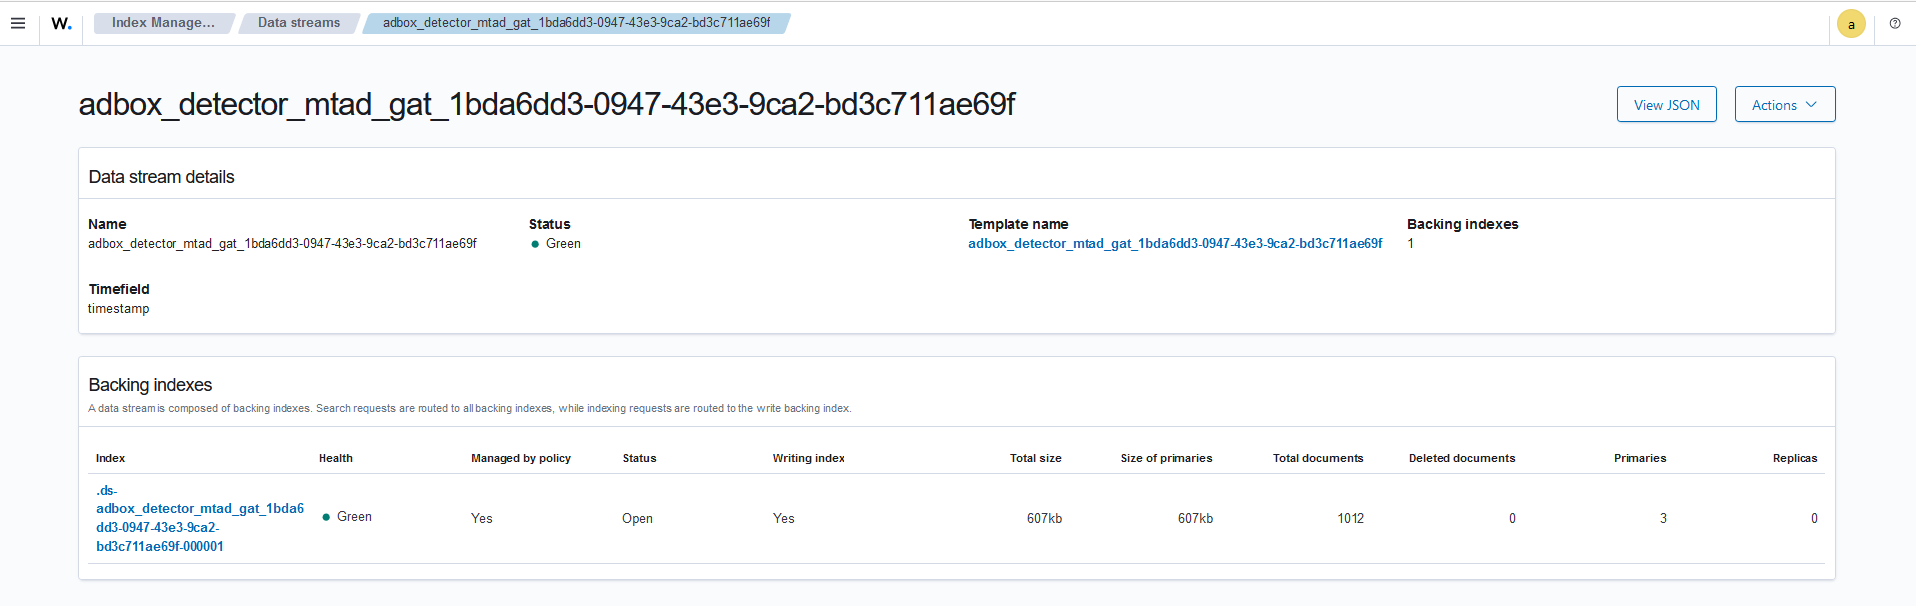
Parent links: SRS-042 Prediction Shipping Feature
| Attribute | Value |
|---|---|
| platform | Ubuntu 22.04.4 LTS |
| execution_type | M |
| verification_method | I |
| release | alpha |
| complexity | 2 |
| test_data | see referenced files |
| version | 0.2 |
1.19 ADBox Wazuh integration Dashboard TST-033
Preconditions and setup actions
- Docker version 26.0.0
- User with root privileges
- An instance of CyFORT-Wazuh distribution should be running.
- A detector data stream
adbox_detector_mtad_gat_{detector_id}available in Wazuh indexer
Test steps
A detailed description of the integration procedure can be found at docs/manual/dashboard_tutorial.md
- Open Dashboard Management.
- Select Dashboard Management>Index patterns and create a new index.
- Add the data stream pattern using the.
- Select
timestampas time field. - Finally, the pattern is created. The field names correspond to the prediction outcome fields.
Expected outcome
- The pattern is created. The field names correspond to the prediction outcome fields.
- The data can be navigated using Discover dashboard.
Parent links: SRS-043 AD Data Visualization
| Attribute | Value |
|---|---|
| platform | Ubuntu 22.04.4 LTS |
| execution_type | M |
| verification_method | I |
| release | alpha |
| complexity | 4 |
| test_data | see referenced files |
| version | 0.2 |
1.20 ADBox set up indexer host address TST-034
Preconditions and setup actions
- ADBox repository
https://github.com/AbstractionsLab/idps-escape.gitcloned on the host. - Wazuh central component deployed.
- User with root privileges
- Built image
siem-mtad-gat:v0.1.4 - No existing container named
siem-mtad-gat-containershould be running.
Test steps
- Open the cloned ADBox repository
- Open the
/siem_mtad_gat/assets/secrets/wazuh_credentials.json - Set "host" as indexer's host address
- Set "port" as indexer's port
- Run
./adbox.sh -c
Expected outcome
- Succesful connection
IDPS-ESCAPE ADBox checking connection with Wazuh/OpenSearch...
Wazuh data ingestor establishing connection to Wazuh...
Connection with Wazuh established successfully!
Parent links: SRS-017 Custom Data Source
| Attribute | Value |
|---|---|
| platform | Ubuntu 22.04.4 LTS |
| execution_type | M |
| verification_method | T |
| release | alpha |
| complexity | 2 |
| test_data | see referenced files |
| version | 0.2 |
1.21 ADBox change indexer credentials TST-035
Preconditions and setup actions
- ADBox repository
https://github.com/AbstractionsLab/idps-escape.gitcloned on the host. - Wazuh central component deployed.
- User with root privileges
- Built image
siem-mtad-gat:v0.1.4 - No existing container named
siem-mtad-gat-containershould be running.
Test steps
- Open the cloned ADBox repository
- Open the
/siem_mtad_gat/assets/secrets/wazuh_credentials.json - Update "username" as indexer's username
- Update "password" as indexer's password
- Run
./adbox.sh -c
Expected outcome
- Succesful connection
IDPS-ESCAPE ADBox checking connection with Wazuh/OpenSearch...
Wazuh data ingestor establishing connection to Wazuh...
Connection with Wazuh established successfully!
Parent links: SRS-022 Indexer Credentials Update
| Attribute | Value |
|---|---|
| platform | MacOS, Windows, GNU/Linux |
| execution_type | M |
| verification_method | T |
| complexity | 2 |
| test_data | see referenced files |
| version | 0.2 |
1.22 Open prediction file of training data TST-037
Preconditions and setup actions
- ADBox dev container running.
- Wazuh central component deployed.
- User with root privileges
- At lease a trained detector.
Test steps
- Open the cloned ADBox repository
- Choose one of the detectors avaliable in
siem_mtad_gat/assets/detector_models. E.g,siem_mtad_gat/assets/detector_models/9a447100-39d1-4e00-83fc-8c618444edf7. - Open
siem_mtad_gat/frontend/viznotebook/result_visualizer.ipynbwithin dev container - Insert dector id in Variables and path to be modified
- Run Notebook
- Go to Running ADBox with a use-case>Training>Training output table
Expected outcome
- Table showing prediction aver train data
Parent links: SRS-030 AD Results Visualization
| Attribute | Value |
|---|---|
| platform | MacOS, Windows, GNU/Linux |
| execution_type | M |
| verification_method | I |
| release | alpha |
| complexity | 2 |
| test_data | see referenced files |
| version | 0.2 |
1.23 Visualize train losses TST-038
Preconditions and setup actions
- Wazuh central component deployed.
- ADBox deployed
- User with root privileges
- At lease a trained detector.
Test steps
- Open the cloned ADBox repository
- Choose one of the detectors avaliable in
siem_mtad_gat/assets/detector_models. - Open
siem_mtad_gat/assets/detector_models/uuid/training/train_losses.pngusing system default software.
Expected outcome
- Graph displaying train_losses.png
Parent links: SRS-031 Training Loss Visualization
| Attribute | Value |
|---|---|
| platform | MacOS, Windows, GNU/Linux |
| execution_type | M |
| verification_method | I |
| release | alpha |
| complexity | 1 |
| test_data | see referenced files |
| version | 0.2 |
1.24 Open prediction raw outcome TST-039
Preconditions and setup actions
- Wazuh central component deployed.
- ADBox deployed
- User with root privileges
- At lease a trained detector used for running prediction at least once (i.e., stored prediction data).
Test steps
- Open the cloned ADBox repository
- Choose one of the detectors avaliable in
siem_mtad_gat/assets/detector_models. - Open
siem_mtad_gat/assets/detector_models/uuid/prediction - Open a prediction file of the
uc-x_predicted_anomalies_data-*.jsonusing system default software.
Expected outcome
-
Prediction info store using json format. E.g.
{
    "run_mode": "REALTIME",
    "detector_id": "563394be-5079-424d-b2ba-cfda0812cf88",
    "start_time": "2024-10-25T08:51:00Z",
    "end_time": "2024-10-25T08:52:00Z",
    "results": [
        {
            "timestamp": "2024-10-25T08:51:00Z",
            "is_anomaly": false,
            "anomaly_score": 0.029846280813217163,
            "threshold": 0.12186630221790373,
            "Forecast_data.5mins_loadAverage_average": 0.1334819793701172,
            "Recon_data.5mins_loadAverage_average": 0.11187170445919037,
            "True_data.5mins_loadAverage_average": 0.1077537015080452,
            "A_Score_data.5mins_loadAverage_average": 0.029846280813217163,
            "Thresh_data.5mins_loadAverage_average": 0.12186630221790373,
            "A_Pred_data.5mins_loadAverage_average": 0.0
        }
    ]
  }
Parent links: SRS-032 Predicted Anomalies Visualization
| Attribute | Value |
|---|---|
| platform | MacOS, Windows, GNU/Linux |
| execution_type | Automated/Manual |
| verification_method | I |
| release | alpha |
| test_data | see referenced files |
| version | 0.2 |
2.0 IDPS-ESCAPE foundation test cases
2.1 Suricata installation in a containerized environment TST-019
Preconditions and setup actions
- Docker version 26.0.0
- User with root privileges
Test steps
- Create a new directory for suricata docker deployment.
- In the directory download the
suricata.yamlconfiguration filedeployment/suricata/suricata.yaml. - Make the required changes in the configuration file as per the network
settings of the respective system as explained
deployment/suricata/suricata_installation.md#suricata-configuration-file. - In the directory download the Dockerfile
deployment/suricata/Dockerfile. - Pull the ubuntu docker base image.
sudo docker pull ubuntu - Build the docker image.
sudo docker build -t suricata-container .
- Run the docker container.
sudo docker run --network=host --hostname=suricata-instance --name=suricatainstance
-it suricata-container
Expected outcome
- Container named
suricata-instanceis running. Verify it by checking the running docker container with this command. sudo docker ps -a - Upon running the
ps auxcommand inside the running container's bash, Suricata services can be seen as a running process. The container bash can be accessed by the following command.sudo docker exec -it suricata-instance bash - In the container's bash run the following command to read Suricata log files.
tail /var/log/suricata/suricata.log
Parent links: SRS-008 Dockerized NIDS Deployment
| Attribute | Value |
|---|---|
| platform | Ubuntu 22.04.4 LTS |
| execution_type | M |
| verification_method | I |
| release | alpha |
| complexity | 3 |
| test_data | see referenced files |
| version | 0.2 |
2.2 Wazuh installation in a containerized environment TST-020
Preconditions and setup actions
- Docker version 26.0.0
- User with root privileges
- Docker Compose version v2.25.0
Test steps
- Clone the Wazuh docker repository in the system as mentioned in section
git clone https://github.com/wazuh/wazuh-docker.git -b v4.8.1
- Navigate to the directory since it is a single node deployment.
cd wazuh-docker/single-node
-
Provide the group of certificates for secure communication.
sudo docker-compose -f generate-indexer-certs.yml run --rm generator -
Deploy Wazuh as single-node using docker-compose.
sudo docker-compose up -dThis could take some time since it would pull all the images.
Expected outcome
- The following output should be visible on the screen after deployment in the background (with -d option)
✔ Container single-node-wazuh.indexer-1 Started
0.1s
✔ Container single-node-wazuh.manager-1 Started
0.1s
✔ Container single-node-wazuh.dashboard-1 Started
-
Run the following command and you should see 3 containers running. By
sudo docker ps -ayou shall seewazuh/wazuh-dashboard:4.8.1,wazuh/wazuh-manager:4.8.1,wazuh-indexer:4.8.1. -
The Wazuh dashboard is accessible through any browser, on the IP address of the system that it is deployed on.
Parent links: SRS-001 Centralized C&C Deployment
| Attribute | Value |
|---|---|
| platform | Ubuntu 22.04.4 LTS |
| execution_type | M |
| verification_method | I |
| release | alpha |
| complexity | 3 |
| test_data | see referenced files |
| version | 0.2 |
2.3 Wazuh agent installation and enrollment: the local machine TST-021
Preconditions and setup actions
- Docker version 26.0.0
- User with root privileges
- Docker Compose version v2.25.0
- Deployment of Wazuh Dashboard version 4.8.1 on the local monitoring machine inside a container
- Deployment of Wazuh Indexer version 4.8.1 on the local monitoring machine inside a container
- Deployment of Wazuh Manager version 4.8.1 on the local monitoring machine inside a container
- GNU bash, version 5.1.16
- No prior agent should already be running on the local monitoring machine
Test steps
- On the Wazuh Dashboard, go to Endpoint Summary, and click on Deploy new agent.
- Select the package to download and install on the respective system i.e., Linux DEB amd64.
- Provide a server address and an optional name for the agent. The server address should be the IP address of the docker host address in the case of docker installation on the local monitoring machine. - The docker host address can be found by:
sudo docker network inspect bridge | grep Gateway
- Install the agent by running the command that should be provided on the dashboard after entering the above information. For example, - download
wget https://packages.wazuh.com/4.x/apt/pool/main/w/wazuh-agent/wazuh-agent_4.8.1-1_arm64.deb && sudo WAZUH_MANAGER='172.17.0.1' WAZUH_AGENT_GROUP='default' WAZUH_AGENT_NAME='idps-escape-1' dpkg -i ./wazuh-agent_4.8.1-1_arm64.deb
- Start the agent by running the three commands that should also be provided on the dashboard, i.e.,
sudo systemctl daemon-reload
sudo systemctl enable wazuh-agent
sudo systemctl start wazuh-agent
Expected outcome
- The status of the agent should be “Started Wazuh agent.” Which is seen by running the command: sudo systemctl status wazuh-agent.
- On the Wazuh Dashboard the Agent should appear as active in the summary page.
Parent links: SRS-003 HIDS Agent Deployment
| Attribute | Value |
|---|---|
| platform | Ubuntu 22.04.4 LTS |
| execution_type | M |
| verification_method | I |
| release | alpha |
| complexity | 3 |
| test_data | see referenced files |
| version | 0.2 |
2.4 Wazuh agent installation and enrollment: remote machine TST-022
Preconditions and setup actions
- Docker version 26.0.0
- User with root privileges
- Docker Compose version v2.25.0
- Deployment of Wazuh Dashboard version 4.8.1 on the local monitoring machine inside a container
- Deployment of Wazuh Indexer version 4.8.1 on the local monitoring machine inside a container
- Deployment of Wazuh Manager version 4.8.1 on the local monitoring machine inside a container
- GNU bash, version 5.1.16
- No prior agent should already be running on a REMOTE monitoring machine
Test steps
- On the Wazuh Dashboard, go to Endpoint Summary, and click on Deploy new agent.
- Select the package to download and install on the REMOTE MACHINE system i.e., Linux DEB amd64.
- Provide a server address (this should be the machine hosting the manager) and an optional name for the agent. - The docker host address can be found by:
sudo docker network inspect bridge | grep Gateway
- Install the agent by running the command in the REMOTE HOST that should be provided on the dashboard after entering the above information. For example, - download
wget https://packages.wazuh.com/4.x/apt/pool/main/w/wazuh-agent/wazuh-agent_4.8.1-1_arm64.deb && sudo WAZUH_MANAGER='172.17.0.1' WAZUH_AGENT_GROUP='default' WAZUH_AGENT_NAME='idps-escape-1' dpkg -i ./wazuh-agent_4.8.1-1_arm64.deb
- Start the agent by running the three commands in the REMOTE HOST that should also be provided on the dashboard, i.e.,
sudo systemctl daemon-reload
sudo systemctl enable wazuh-agent
sudo systemctl start wazuh-agent
Expected outcome
- The status of the agent should be “Started Wazuh agent.” Which is seen by running the command: sudo systemctl status wazuh-agent.
- On the Wazuh Dashboard the Agent should appear as active in the summary page.
Parent links: SRS-023 Agent Registration Process
| Attribute | Value |
|---|---|
| platform | Ubuntu 22.04.4 LTS |
| execution_type | M |
| verification_method | I |
| release | alpha |
| complexity | 3 |
| test_data | see referenced files |
| version | 0.2 |
2.5 Wazuh agent deletion and uninstallation TST-023
Preconditions and setup actions
- Docker version 26.0.0
- User with root privileges
- Docker Compose version v2.25.0 curl version 7.81.0
- Wazuh agent installed and enrolled with the manager
- Wazuh API Token
- Deployment of Wazuh Dashboard on the local monitoring machine inside a container (4.8.1)
- Deployment of Wazuh Indexer on the local monitoring machine inside a container (4.8.1)
- Deployment of Wazuh Manager on the local monitoring machine inside a container (4.8.1)
Test steps
- Using the Wazuh API Token, send a DELETE request through the Wazuh API to the Wazuh manager. The request should also contain the IDs of the agents to be deleted.
curl -k -X DELETE "https://[Wazuh Server Address]:55000/agents?pretty=true&older_than=0s&agents_list=[Comma separated agent IDs]&status=all"
-H "Authorization: Bearer $TOKEN"
- Uninstall the agent by running the following commands.
sudo apt-get remove --purge wazuh-agent
sudo systemctl disable wazuh-agent
sudo systemctl daemon-reload
Expected outcome
- After deleting the agent, the agent should not be visible in the list of agents on the Wazuh Dashboard.
- The agent should also not be present in the list of available agents on the
machine, which can be checked by the following command.
sudo /var/ossec/bin/manage_agents -l - After uninstalling the agent, no command regarding the agent should work.
- The agent removal can also be verified from the Wazuh manager.
- Access the bash of the container which is running the Wazuh Manager.
sudo docker exec -it [Container name or ID of Wazuh Manager] bash - Run the command to access the Agent Manager.
/var/ossec/bin/manage_agents - The removal can be confirmed by entering
Land pressing ENTER to verify its absence from the Available Agents listing.
Parent links: SRS-004 HIDS Agent Management
| Attribute | Value |
|---|---|
| platform | Ubuntu 22.04.4 LTS |
| execution_type | M |
| verification_method | I |
| release | alpha |
| complexity | 3 |
| test_data | see referenced files |
| version | 0.2 |
2.6 Wazuh agent unenrollment TST-024
Preconditions and setup actions
- Docker version 26.0.0
- User with root privileges
- Docker Compose version v2.25.0 curl version 7.81.0
- Wazuh agent installed and enrolled with the manager
- Deployment of Wazuh Dashboard on the local monitoring machine inside a container (4.8.1)
- Deployment of Wazuh Indexer on the local monitoring machine inside a container (4.8.1)
- Deployment of Wazuh Manager on the local monitoring machine inside a container (4.8.1)
Test steps
- Access the bash of the container which is running the Wazuh Manager.
sudo docker exec -it [Container name or ID of
Wazuh Manager] bash
- Run the command to access the Agent Manager.
/var/ossec/bin/manage_agents - Press
<R>which is the option for removing and agent and press enter. - Enter the ID of the agent to be removed and unenroll from the manager.
e. Confirm the removal action by pressing
<Y>and enter.
Expected outcome
- After confirming the output should be a confirmation message, "Agent
IDremoved". - After deleting the agent, the agent should not be visible in the list of agents on the Wazuh Dashboard.
- The agent should also not be present in the list of available agents on the
machine, which can be checked by the following command.
sudo /var/ossec/bin/manage_agents -l
Parent links: SRS-004 HIDS Agent Management
| Attribute | Value |
|---|---|
| platform | Ubuntu 22.04.4 LTS |
| execution_type | M |
| verification_method | I |
| release | alpha |
| complexity | 2 |
| test_data | see referenced files |
| version | 0.2 |
2.7 Suricata and Wazuh Integration TST-025
Preconditions and setup actions
- Docker version 26.0.0
- User with root privileges
- Docker Compose version v2.25.0 curl version 7.81.0
- Wazuh agent installed and enrolled with the manager
- Deployment of Wazuh Dashboard on the local monitoring machine inside a container (4.8.1)
- Deployment of Wazuh Indexer on the local monitoring machine inside a container (4.8.1)
- Deployment of Wazuh Manager on the local monitoring machine inside a container (4.8.1)
- Deployment of Suricata version 7.0.3 on the local monitoring machine inside a container
- GNU nano, version 6.2
- curl version 7.81.0
Test steps
- Edit the configuration file of the Wazuh agent to make it able to read
Suricata logs.
sudo nano /var/ossec/etc/ossec.conf - Add the suricata eve logs the end of the file, before the last
</ossec_config>closing tag.
<ossec_config>
...
  <localfile>
    <log_format>json</log_format>
    <location>/var/log/suricata/eve.json</location>
  </localfile>
</ossec_config>
- Remove the Suricata container.
sudo docker rm suricata-instance - Run the Suricata container again with adding arguments to create docker volumes.
sudo docker run -v
/var/log/suricata:/var/log/suricata --network=host
--hostname=suricata-instance --name=suricatainstance
-d suricata-container
- Restart the Wazuh agent
sudo systemctl restart wazuh-agent
- Generate some malicious network traffic by sending a curl request to the following tool.
curl -sSL
https://raw.githubusercontent.com/3CORESec/testmynids.org/master/tmNIDS -o /tmp/tmNIDS && chmod +x /tmp/tmNIDS && /tmp/tmNIDS
- Enter any number from 1 to 11 to generate the respective traffic.
- On the Wazuh dashboard, filter the alerts to see the events particularly generated by Suricata. This is done by Threat Hunting > Add Filter. And to create the filter, in the Field dropdown, select rule.groups, in the operator dropdown, select is and in the Value, write suricata.
Expected outcome
-The alert generated by Suricata for the malicious traffic should be seen on the Wazuh Dashboard Threat Hunting. - After filter application, all alerts generated by suricata should be visible.
Parent links: SRS-010 Centralized Threat Management
| Attribute | Value |
|---|---|
| platform | Ubuntu 22.04.4 LTS |
| execution_type | M |
| verification_method | I |
| release | alpha |
| complexity | 3 |
| test_data | see referenced files |
| version | 0.2 |
2.8 Port mirroring for remote machines TST-026
Preconditions and setup actions
- Ubuntu 22.04.4 LTS (Machine 1, central monitoring host)
- Ubuntu 22.04.4 LTS (Machine 2, target host or the remote machine)
-
Prerequisites for Machine 1:
- tcpdump version 4.99.1
- User with root privileges
-
Prerequisites for Machine 2:
- User with root privileges
- ping from iputils 20211215
- GNU bash, version 5.1.16
- No existing tunnel is configured from machine 2 to machine 1
Test steps
- Create a GRE tunnel from machine 2 to machine 1 and mirror all the
ingress and egress (incoming and outgoing) network traffic generated on
machine 2 to machine 1. Using the procedure describe in
deployment/remote_monitoring/remote_monitoring.md.
- From machine 2, send some ICMP echo request packets to machine 1.
ping -c3 [IP of the capture interface of machine
1]
- On machine 1, use tcpdump to capture network traffic on the default interface.
sudo tcpdump -n -i [Capture interface of machine
1]
Expected outcome
tcpdump output should show that machine 1 receives both the ingress and egress ICMP packets from machine 2, encapsulated within GRE packets
Parent links: SRS-007 Raw Traffic Capture
| Attribute | Value |
|---|---|
| platform | Ubuntu 22.04.4 LTS |
| execution_type | M |
| verification_method | A |
| release | alpha |
| complexity | 4 |
| test_data | see referenced files |
| version | 0.2 |
2.9 Traffic monitoring on Wazuh (local) TST-027
Preconditions and setup actions
- Docker version 26.0.0
- User with root privileges
- Docker Compose version v2.25.0 curl version 7.81.0
- Wazuh agent installed and enrolled with the manager
- Deployment of Wazuh Dashboard on the local monitoring machine inside a container (4.8.1)
- Deployment of Wazuh Indexer on the local monitoring machine inside a container (4.8.1)
- Deployment of Wazuh Manager on the local monitoring machine inside a container (4.8.1)
- Deployment of Suricata version 7.0.3 on the local monitoring machine inside a container
- GNU nano, version 6.2
- curl version 7.81.0
- Wazuh agent configured to integrate with Suricata
Test steps
- Generate some malicious network traffic on the monitored machine by sending a curl request to the following tool.
curl -sSL
https://raw.githubusercontent.com/3CORESec/testmynids.org/master/tmNIDS -o /tmp/tmNIDS && chmod +x /tmp/tmNIDS && /tmp/tmNIDS
- Enter any number from 1 to 11 to generate the respective traffic on the console.
Expected outcome
The alert generated by Suricata for the malicious traffic should be seen on the Wazuh Dashboard.
Parent links: SRS-011 Network Event Visualization
| Attribute | Value |
|---|---|
| platform | Ubuntu 22.04.4 LTS |
| execution_type | M |
| verification_method | I |
| release | alpha |
| complexity | 4 |
| test_data | see referenced files |
| version | 0.2 |
2.10 Traffic monitoring on Wazuh (remote) TST-028
Preconditions and setup actions
- Docker version 26.0.0
- User with root privileges
- Docker Compose version v2.25.0 curl version 7.81.0
- Wazuh agent installed and enrolled with the manager in remote machine
- Deployment of Wazuh Dashboard on the local monitoring machine inside a container (4.8.1)
- Deployment of Wazuh Indexer on the local monitoring machine inside a container (4.8.1)
- Deployment of Wazuh Manager on the local monitoring machine inside a container (4.8.1)
- Deployment of Suricata version 7.0.3 on the remote monitoring machine inside a container
- GNU nano, version 6.2
- curl version 7.81.0
- Wazuh agent configured to integrate with Suricata
- GRE tunnel created from the remote machine to the local monitoring machine which mirrors all the ingress and egress network traffic from the remote machine to the local monitoring machine
Test steps
-
Generate some malicious network traffic on the remote monitored machine by sending a curl request to the following tool.
curl -sSL https://raw.githubusercontent.com/3CORESec/testmynids.org/master/tmNIDS -o /tmp/tmNIDS && chmod +x /tmp/tmNIDS && /tmp/tmNIDS -
Enter any number from 1 to 11 to generate the respective traffic on the console.
-
On the Wazuh dashboard, filter the alerts to see the events particularly related to the remote machine. This is done bya adding a filter. And to create the filter, in the Field dropdown, select
data.tunnel.src_ip, in the operator dropdown, selectisand in the Value, write the IP of the capture interface of the remote machine where the GRE tunnel was created.
Note that after creating the tunnel there could be a possible delay of some minutes between the creation of the tunnel and the display of the events on the Wazuh dashboard.
Expected outcome
Step 2.
The alert generated by Suricata for the malicious traffic should be seen on the Wazuh Dashboard.
Step 3.
- The alert generated by Suricata for the malicious traffic should be seen on the Wazuh Dashboard.
- The filter application should show the Suricata alert for the test traffic that was run.
Parent links: SRS-011 Network Event Visualization
| Attribute | Value |
|---|---|
| platform | Ubuntu 22.04.4 LTS |
| execution_type | M |
| verification_method | I |
| release | alpha |
| complexity | 4 |
| test_data | see referenced files |
| version | 0.2 |
2.11 Changing password for Wazuh indexer users TST-029
Preconditions and setup actions
- Docker version 26.0.0
- User with root privileges
- Docker Compose version v2.25.0 curl version 7.81.0
- Wazuh agent installed and enrolled with the manager
- Deployment of Wazuh Dashboard on the local monitoring machine inside a container (4.8.1)
- Deployment of Wazuh Indexer on the local monitoring machine inside a container (4.8.1)
- Deployment of Wazuh Manager on the local monitoring machine inside a container (4.8.1)
- Deployment of Suricata version 7.0.3 on the local monitoring machine inside a container
- GNU nano, version 6.2
Test steps
The change password procedure is more detailed in deployment/wazuh/change_passwords.md.
Part 1: Genereate Hash
- Stop the deployment stack if it's running. From wazuh repository:
sudo docker-compose down
- Run the following command to generate the hash of the new password. Once the container launches, input the new password and press Enter.
sudo docker run --rm -ti wazuh/wazuhindexer:4.8.1 bash /usr/share/wazuhindexer/plugins/opensearchsecurity/tools/hash.sh
- Copy the generated hash.
- Open the
config/wazuh_indexer/internal_users.ymlfile. Locate the block for the user for whom the password is being changed for.
Part 2: Set the new password.
- In the
docker-compose.ymlfile, replace all instances of the old password with the new one.
Part 3: Apply changes
- Start the deployment stack.
sudo docker-compose up -d
- Enter the container bash.
sudo docker exec -it [Name or ID of the Wazuh Indexer container] bash
- Set the following variables:
export INSTALLATION_DIR=/usr/share/wazuhindexer
CACERT=$INSTALLATION_DIR/certs/root-ca.pem
KEY=$INSTALLATION_DIR/certs/admin-key.pem
CERT=$INSTALLATION_DIR/certs/admin.pem
export JAVA_HOME=/usr/share/wazuhindexer/jdk
- Wait for the Wazuh indexer to initialize properly. The waiting
time can vary from two to five minutes. It depends on the size of
the cluster, the assigned resources, and the speed of the
network. Then, run the
securityadmin.shscript to apply all changes.
bash /usr/share/wazuhindexer/plugins/opensearchsecurity/tools/securityadmin.sh -cd /usr/share/wazuh-indexer/opensearchsecurity/ -nhnv -cacert $CACERT -cert $CERT -key $KEY -p 9200 -icl
-
Exit the Wazuh indexer container and login with the new credentials on the Wazuh dashboard.
-
Enter any number from 1 to 11 to generate the respective traffic on the console.
Expected outcome
-The Wazuh dashboard should show "Invalid username or password. Please try again." error while trying to login with the old password. - The Wazuh dashboard should be accessible through the new password.
Parent links: SRS-016 Indexer Credential Management
| Attribute | Value |
|---|---|
| platform | Ubuntu 22.04.4 LTS |
| execution_type | Automated/Manual |
| verification_method | I |
| release | alpha |
| complexity | 4 |
| test_data | see referenced files |
| version | 0.2 |
2.12 Changing password for Wazuh API users TST-030
Preconditions and setup actions
- Docker version 26.0.0
- User with root privileges
- Docker Compose version v2.25.0 curl version 7.81.0
- Wazuh agent installed and enrolled with the manager
- Deployment of Wazuh Dashboard on the local monitoring machine inside a container (4.8.1)
- Deployment of Wazuh Indexer on the local monitoring machine inside a container (4.8.1)
- Deployment of Wazuh Manager on the local monitoring machine inside a container (4.8.1)
- Deployment of Suricata version 7.0.3 on the local monitoring machine inside a container
- GNU nano, version 6.2
Test steps
The change password procedure is more detailed in deployment/wazuh/change_passwords.md.
Part 1: Genereate Hash
- Stop the deployment stack if it's running. From wazuh repository:
sudo docker-compose down
- Run the following command to generate the hash of the new password. Once the container launches, input the new password and press Enter.
sudo docker run --rm -ti wazuh/wazuhindexer:4.8.1 bash /usr/share/wazuhindexer/plugins/opensearchsecurity/tools/hash.sh
- Copy the generated hash.
- Open the
config/wazuh_indexer/internal_users.ymlfile. Locate the block for the user for whom the password is being changed for.
Part 2: Set the new password.
- In the
docker-compose.ymlfile, replace all instances of the old password with the new one atAPI_PASSWORDoccurrence.
Part 3: Apply changes
- Start the deployment stack.
sudo docker-compose up -d
Expected outcome
- Trying to obtain Wazuh API token using the old password, which can be done in the following way (make sure that the password is within inverted quotes).
TOKEN=$(curl -u wazuh-wui:"MyS3cr37P450r.*-" -k -X POST "https://172.17.0.1:55000 /security/user/authenticate?raw=true"); echo $TOKENThis hould return the following error.{"title": "Unauthorized", "detail": "Invalid credentials"} - The token can be successfully obtained using the new password.
Parent links: SRS-016 Indexer Credential Management
| Attribute | Value |
|---|---|
| platform | Ubuntu 22.04.4 LTS |
| execution_type | M |
| verification_method | I/T |
| release | alpha |
| complexity | 4 |
| test_data | see referenced files |
| version | 0.2 |
2.13 Wazuh filters using the RESTful API TST-031
Preconditions and setup actions
- Docker version 26.0.0
- User with root privileges
- Docker Compose version v2.25.0 curl version 7.81.0
- Wazuh agent installed and enrolled with the manager in remote machine
- Wazuh agent installed and enrolled with the manager in local machine
- Deployment of Wazuh Dashboard on the local monitoring machine inside a container (4.8.1)
- Deployment of Wazuh Indexer on the local monitoring machine inside a container (4.8.1)
- Deployment of Wazuh Manager on the local monitoring machine inside a container (4.8.1)
- Deployment of Suricata version 7.0.3 on the remote monitoring machine inside a container
- GNU nano, version 6.2
- curl version 7.81.0
- Wazuh agent configured to integrate with Suricata
- GRE tunnel created from the remote machine to the local monitoring machine which mirrors all the ingress and egress network traffic from the remote machine to the local monitoring machine
Test steps
- Get the Wazuh API Token.
- Run the following query to apply the filter:
curl -G "q=data.tunnel.src_ip=[IP of the tunnel source interface]" -k -X GET "https://[Wazuh Manager IP address]:55000/manager/logs?limit=500&pretty=true" -H "Authorization: Bearer $TOKEN"
Expected outcome
- The output of the query should show JSON decoded logs and in the last there should be a success message. "message: Logs were successfully read, error: 0"
Parent links: SRS-024 Event Querying Capability
| Attribute | Value |
|---|---|
| platform | Ubuntu 22.04.4 LTS |
| execution_type | M |
| verification_method | I |
| release | alpha |
| complexity | 4 |
| test_data | see referenced files |
| version | 0.2 |
2.14 Wazuh filters using the Wazuh Dashboard TST-032
Preconditions and setup actions
- Docker version 26.0.0
- User with root privileges
- Docker Compose version v2.25.0 curl version 7.81.0
- Wazuh agent installed and enrolled with the manager in remote machine
- Wazuh agent installed and enrolled with the manager in local machine
- Deployment of Wazuh Dashboard on the local monitoring machine inside a container (4.8.1)
- Deployment of Wazuh Indexer on the local monitoring machine inside a container (4.8.1)
- Deployment of Wazuh Manager on the local monitoring machine inside a container (4.8.1)
- Wazuh agent configured to integrate with Suricata
- GRE tunnel created from the remote machine to the local monitoring machine which mirrors all the ingress and egress network traffic from the remote machine to the local monitoring machine
Test steps
- On the Wazuh dashboard navigate to Threat Hunting and filter by
data.tunnel.src_ip:[IP remote machine].
Expected outcome
- The output of the query should show JSON decoded logs and in the last there should be a success message. "message: Logs were successfully read, error: 0"
Parent links: SRS-011 Network Event Visualization
| Attribute | Value |
|---|---|
| platform | Ubuntu 22.04.4 LTS |
| execution_type | M |
| verification_method | I |
| release | alpha |
| complexity | 2 |
| test_data | see referenced files |
| version | 0.2 |
2.15 Map a detected event to MITRE ATT&CKS TST-036
Preconditions and setup actions
- Wazuh central component deployed.
- Presence of alerts collected in Wazuh indexer.
Test steps
- Open Wazuh Dashboard
- Go to Threat Hunting > Events> Add Filter and choose
rule.mitre.idexists. - Inspect filtered output (possibly extend time interval for more results).
Expected outcome
- In json
rule.mitre.idkey should include the matching MITRE ID. E.g. T1078, T1021
"mitre": {
      "technique": [
        "Valid Accounts",
        "Remote Services"
      ],
      "id": [
        "T1078",
        "T1021"
      ],
      "tactic": [
        "Defense Evasion",
        "Persistence",
        "Privilege Escalation",
        "Initial Access",
        "Lateral Movement"
      ]
    },
    "id": "5715",
    "gpg13": [
      "7.1",
      "7.2"
    ]
  }
Parent links: SRS-025 MITRE ATT&CK Mapping
| Attribute | Value |
|---|---|
| platform | MacOS, Windows, GNU/Linux |
| execution_type | Automated/Manual |
| verification_method | I |
| release | alpha |
| complexity | 2 |
| test_data | see referenced files |
| version | 0.2 |
2.16 Visualize IDPS-ESCAPE high level architecture TST-040
Preconditions and setup actions
- A copy of ADBox project repository
Test steps
- Open the
docs/traceability/HARC.htmlfile using the browser
Expected outcome
- Wab page displaying IDPS architecture diagrams
Parent links: SRS-045 High-Level Architecture Overview
| Attribute | Value |
|---|---|
| platform | MacOS, Windows, GNU/Linux |
| execution_type | M |
| verification_method | I |
| release | alpha |
| complexity | 1 |
| test_data | see referenced files |
| version | 0.2 |
3.0 RADAR test case specifications
3.1 Setup RADAR foundation TST-041
Preconditions and setup actions
- A test controller host/node is available:
- A Linux machine/VM (the Ansible control node) is available to the tester.
- OS: recent GNU/Linux distribution, preferably an Ubuntu distribution (22.04+).
- A second test node (accessible via the controller node) is available: GNU/Linux distro e.g. Debian GNU/Linux 13 (trixie)
- Ansible is installed on the controller host:
- Location: install Ansible only on the controller node.
- Installation reference:
- if
pipxis available, follow the instruction` in Ansible Installation Documentation using pipx. - otherwise, follow the official instructions for Linux distributions.
- Minimum version: Ansible
2.15+.
- if
- Targeted Wazuh manager and agent versions:
4.12.0 - Environment values such as
OS_URL,OS_USER,OS_PASS,DASHBOARD_URL,DASHBOARD_USER,DASHBOARD_PASSand SMTP credentials are available to the tester. The tester has network access (SSH) from the test controller node to controlled endpoints. - If either the Wazuh agent (aka agent) or the Wazuh manager (aka manager) is chosen to be
remote:- the remote agent/manager needs to have Docker and Docker Compose installed following the official documentations for Docker and Docker Compose.
- an available user in remote agent or manager with sudo access, and tester needs to have SSH access to the user from test controller host.
- If the agents are to be deployed on
remotenodes, the Wazuh agents must be installed in the monitored endpoints using the official documentation. - The agent must be registered with the Wazuh manager following the official documentation.
Test steps
- In the controller host, the working directory is required to be
radar:
cd radar
- Set
.envfile with required variables:
# =======================
# OpenSearch Configuration
# =======================
OS_URL=https://192.168.5.4:9200
OS_USER=admin
OS_PASS=SecretPassword
OS_VERIFY_SSL="/app/config/wazuh_indexer_ssl_certs/root-ca.pem"

DASHBOARD_URL=https://192.168.5.4
DASHBOARD_USER=admin
DASHBOARD_PASS=SecretPassword
DASHBOARD_VERIFY_SSL="/app/config/wazuh_indexer_ssl_certs/root-ca.pem"

WAZUH_API_URL=https://192.168.5.4:55000
WAZUH_AUTH_USER=wazuh-wui
WAZUH_AUTH_PASS=MyS3cr37P450r.*-

WAZUH_AGENT_VERSION=4.12.0-1
WAZUH_MANAGER_ADDRESS=192.168.5.4

WEBHOOK_NAME="RADAR_Webhook"
WEBHOOK_URL=http://192.168.5.4:8080/notify

# =======================
# Logging
# =======================

AR_LOG_FILE=/var/ossec/logs/active-responses.log

# =======================
# SMTP
# =======================

SMTP_HOST=SMTP_HOST # Change accordingly
SMTP_PORT=SMTP_PORT # Change accordingly
SMTP_USER=SMTP_USER # Change accordingly
SMTP_PASS=SMTP_PASS # Change accordingly
EMAIL_TO=RECEIVER_EMAIL@example.com # Change accordingly
SMTP_STARTTLS=yes
-
In case either the agent or the manager is remote:
3.1. Change
inventory.yamlbased on remote agent/manager data, user credentials and docker container names. Change is needed:- for remote agents, the endpoint part
wazuh_agents_sshmust be configured. - for a remote manager, the endpoint part
wazuh_manager_sshmust be configured. - in each of the above two, you may need to define a
ansible_ssh_private_key_file: <path-to-ssh-key>attribute (to enable access from the control node to the controlled node)
3.2. Create a vault for each host in
inventory.yaml(IMPORTANT: the vault name and host name must match):- for remote agents:
ansible-vault create host_vars/edge.vm.yml - for remote manager:
ansible-vault create host_vars/mgr.remote.yml
3.3. Assign a vault password and set sudo password:
ansible_become_password: <selected-user-sudo-password> - for remote agents, the endpoint part
-
Existence of Wazuh manager on targeted endpoint (local/remote) (signaled via
manager_existsflag used bybuild-radar.sh):4.1. In case the manager does not exist, certificates must be issued matching the
MANAGER_IPandINDEXER_IPaccording to the documentation inconfig/wazuh_indexer_ssl_certs/README.md; in short, once you have adaptedconfig/certs.ymlaccording to your endpoints (IP address and container name), from within theconfigfolder, rundocker run --rm -it -v "PWD/certs.yml:/config/certs.yml:ro"−v"PWD/certs.yml:/config/certs.yml:ro" -v "PWD/certs.yml:/config/certs.yml:ro"−v"PWD/wazuh_indexer_ssl_certs:/certificates" wazuh/wazuh-certs-generator:0.0.24.2. If the manager is already in place, certificates must be copied into
config/wazuh_indexer_ssl_certs.
Expected outcome
-
In the controller host, the vaults are created and SSH access is set correctly:
- if the agent is chosen to be remote:
3.1 The vault is created and exists in
host_vars/:ansible-vault view host_vars/edge.vm.yml3.2 Ansible reaches the SSH group:
ansible -i inventory.yaml wazuh_agents_ssh -m ping --ask-vault-pass- if the manager is chosen to be remote:
3.1 The vault is created and exists in
host_vars/:ansible-vault view host_vars/mgr.remote.yml3.2 Ansible reaches the SSH group:
ansible -i inventory.yaml wazuh_manager_ssh -m ping --ask-vault-pass -
The certificates are available under
config/wazuh_indexer_ssl_certs/:
ls config/wazuh_indexer_ssl_certs/
Child links: TRB-008 TCER: Setup RADAR foundation
| Attribute | Value |
|---|---|
| platform | GNU/Linux (Ubuntu+Debian) |
| execution_type | Manual |
| verification_method | T |
| release | alpha |
| complexity | 3 |
| test_data | see referenced files |
| version | 0.5 |
3.2 RADAR: build suspicious login TST-042
Preconditions and setup actions
- RADAR is setup according to TST-041
Test steps
- In the controller host, the working directory is required to be
radar:
cd radar
- Build RADAR with SCENARIO_NAME suspicious_login:
./build-radar.sh suspicious_login --agent remote/local --manager remote/local --manager_exists true/false
In this step, please choose options according to your setup:
-
--agentWhere agents live: local (docker-compose.agents.yml) | remote (SSH endpoints) -
--managerWhere manager lives: local (docker-compose.core.yml) | remote (SSH host) -
--manager_existsWhether the manager already exists at that location:- true : do not bootstrap a manager
- false : bootstrap a manager
-
--ssh-keyOptional: path to the SSH private key used for remote manager/agent access. If not provided, defaults to:$HOME/.ssh/id_ed25519
- To clean up the test environment only after a successful test execution AND a successful execution of TST-046:
- In case the manager is chosen to be
local, in the controller node/host, run these commands:
./stop-radar.sh --all
- In case the manager is chosen to be
remoteand bootstrapped, in the manager endpoint, run these commands to clean up the test environment:
cd /tmp/radar_mgr_XXXXXXX
ls docker-compose.core.yml
./stop-radar.sh --all
cd /tmp
rm -rf radar_mgr_*
Each Ansible run creates a staging directory in the endpoint where the manager is bootstrapped. The successful run directory (starts with radar_mgr_ ending with a random identifier XXXXXXX) should be checked for the existence of a Docker Compose file and then cleaned.
- In case the agent is chosen to be
local, in the controller node/host, run this command:
docker compose -f docker-compose.agents.yml down -v
Expected outcome
2. Check the setup
In Wazuh Manager
Connect to the Wazuh manager to be able to perform the following verifications:
docker exec -it wazuh.manager bash
- 2.1 Custom
0310 SSHdecoder deployed; verify this by running
ls -l /var/ossec/etc/decoders/0310-ssh.xml
to ensure that 0310-ssh.xml exists, and is owned by root:wazuh, mode 0640.
- 2.2 Custom
0310 SSHdecoder should contain the decoderssshd-*-with-radar(e.g., including RADAR fields likeASN,country,geo_velocity)
tail -n20 /var/ossec/etc/decoders/0310-ssh.xml
to ensure that RADAR enrichment fields will be parsed.
- 2.3 Default
0310 decoderis excluded inossec.conf; verify via
grep '<decoder_exclude>0310-ssh_decoders.xml</decoder_exclude>' /var/ossec/etc/ossec.conf
to ensure that a <decoder_exclude>0310-ssh_decoders.xml</decoder_exclude> line appears (ideally once) under <ruleset>.
- 2.4 RADAR rules for suspicious_login are in
local_rules.xml; verify via
grep -n 'RADAR_RULES: suspicious_login' /var/ossec/etc/rules/local_rules.xml
to ensure local_rules.xml contains a <!-- RADAR_RULES: suspicious_login BEGIN/END --> block with rules for suspicious SSH logins.
- 2.5 Suspicious login rules are bound to active responses; verify via
grep -A5 'email_ar' /var/ossec/etc/ossec.conf
to ensure that suspicious login rule ID(s) references the intended <group>, <options> or <active-response> that trigger ad_context_* and email_ar.py.
- 2.6 Agent is registered with the manager; verify via
/var/ossec/bin/agent_control -l
to ensure that an entry exists for each agent.
- 2.7 Wazuh Manager is running after restart; verify via
/var/ossec/bin/wazuh-control status
to ensure that status output indicates the manager is running with no error messages.
In endpoints running agents
- 2.8 RADAR helper directory and script are installed on the SSH agent host; verify via
ls -ld /opt/radar
ls -l /opt/radar/radar-helper.py
to ensure /opt/radar exists with mode 0755 and owner root:root; radar-helper.py exists with mode 0750 and owner root:root.
- 2.9
radar-helper.servicesystemd unit is installed, enabled, and running; verify via
systemctl status radar-helper.service
to ensure the service is active.
- 2.10 Agent
ossec.confon SSH agent includes the suspicious_login RADAR snippet; verify via
grep -n 'RADAR' /var/ossec/etc/ossec.conf
to ensure that /var/ossec/etc/ossec.conf exists with owner root:wazuh, mode 0640, and contains a <!-- RADAR: suspicious_login BEGIN/END --> block inserted before </ossec_config>.
- 2.11 Active response scripts for suspicious_login are present on SSH agents; verify via
ls -l /var/ossec/active-response/bin/
to ensure that files from radar/scenarios/active_responses/* are present under /var/ossec/active-response/bin/ with owner root:wazuh and mode 0750.
- 2.12 Wazuh agent service is running on SSH agents after restart; verify via
/var/ossec/bin/wazuh-control status
to ensure that the status output indicates the agent is running with no error messages.
Post-test cleanup
- 3 Check the cleanup after successful validations, the command output should be empty:
docker ps
Parent links: SRS-051 Suspicious login Detection and Prevention: Impossible travel and Failed-login bursts
Child links: TRB-009 TCER: RADAR build suspicious login
| Attribute | Value |
|---|---|
| platform | GNU/Linux (Ubuntu+Debian) |
| execution_type | Manual |
| verification_method | T |
| release | alpha |
| complexity | 3 |
| test_data | see referenced files |
| version | 0.5 |
3.3 RADAR: build non-whitelist GeoIP detection TST-043
Preconditions and setup actions
- RADAR is setup according to TST-041
Test steps
- In the controller host, the working directory is required to be
radar:
cd radar
- Build RADAR with SCENARIO_NAME geoip_detection:
./build-radar.sh geoip_detection --agent remote/local --manager remote/local --manager_exists true/false
In this step, please choose options according to your setup:
-
--agentWhere agents live: local (docker-compose.agents.yml) | remote (SSH endpoints) -
--managerWhere manager lives: local (docker-compose.core.yml) | remote (SSH host) -
--manager_existsWhether the manager already exists at that location:- true : do not bootstrap a manager
- false : bootstrap a manager
-
--ssh-keyOptional: path to the SSH private key used for remote manager/agent access. If not provided, defaults to:$HOME/.ssh/id_ed25519
- To clean up the test environment only after a successful test execution AND a successful execution of TST-046:
- In case the manager is chosen to be
local, in the controller node/host, run these commands:
./stop-radar.sh --all
- In case the manager is chosen to be
remoteand bootstrapped, in the manager endpoint, run these commands to clean up the test environment:
cd /tmp/radar_mgr_XXXXXXX
ls docker-compose.core.yml
./stop-radar.sh --all
cd /tmp
rm -rf radar_mgr_*
Each Ansible run creates a staging directory in the endpoint where the manager is bootstrapped. The successful run directory (starts with radar_mgr_ ending with a random identifier XXXXXXX) should be checked for the existence of a Docker Compose file and then cleaned.
- In case the agent is chosen to be
local, in the controller node/host, run this command:
docker compose -f docker-compose.agents.yml down -v
Expected outcome
2. Check the setup
In Wazuh Manager
Connect to the Wazuh manager to be able to perform the following verifications:
docker exec -it wazuh.manager bash
- 2.1 Whitelist file exists
ls -l /var/ossec/etc/lists/whitelist_countries
to ensure that /var/ossec/etc/lists/whitelist_countries exists, its contents match the scenario’s whitelist_countries, and its owner is root:wazuh, with mode 0644.
- 2.2
ossec.confhas<list>entry forwhitelist_countries
grep -n 'whitelist_countries' /var/ossec/etc/ossec.conf
to ensure under <ruleset>, there is a <list>...whitelist_countries</list> entry with the RADAR marker for geoip_detection.
- 2.3 Custom
0310 SSHdecoder deployed; verify this by running
ls -l /var/ossec/etc/decoders/0310-ssh.xml
to ensure that 0310-ssh.xml exists, and is owned by root:wazuh, mode 0640.
- 2.4 Default
0310 decoderis excluded inossec.conf; verify via
grep '<decoder_exclude>0310-ssh_decoders.xml</decoder_exclude>' /var/ossec/etc/ossec.conf
to ensure that a <decoder_exclude>0310-ssh_decoders.xml</decoder_exclude> line appears (ideally once) under <ruleset>.
- 2.5 RADAR rules for
geoip_detectionexist
grep -n 'RADAR_RULES: geoip_detection' /var/ossec/etc/rules/local_rules.xml
to check local_rules.xml contains a RADAR_RULES: geoip_detection block rules use whitelist_countries to detect non-whitelisted countries.
- 2.6 GeoIP non-whitelist rules are bound to active responses
grep -A10 'email_ar' /var/ossec/etc/ossec.conf
to check GeoIP non-whitelist rule ID(s) reference the correct <active-response>.
In endpoints running agents
- 2.7 RADAR helper directory and script are installed on the SSH agent host.
ls -ld /opt/radar
ls -l /opt/radar/radar-helper.py
to check /opt/radar exists with mode 0755 and owner root:root; radar-helper.py exists with mode 0750 and owner root:root.
- 2.8
radar-helper.servicesystemd unit is installed, enabled, and running.
systemctl status radar-helper.service
to check that the service is active.
- 2.9 Agent
ossec.confon SSH agent includes thegeoip_detectionRADAR snippet.
grep -n 'RADAR' /var/ossec/etc/ossec.conf
to check: /var/ossec/etc/ossec.conf exists with owner root:wazuh, mode 0640, and contains a <!-- RADAR: geoip_detection BEGIN/END --> block inserted before </ossec_config>.
- 2.10 Wazuh agent service is running on SSH agents after restart.
/var/ossec/bin/wazuh-control status
to ensure status output indicates the agent is running with no error messages.
Post-test cleanup
- 3 Check the cleanup after successful validations, the command output should be empty:
docker ps
Parent links: SRS-055 Geo-based Access Control: Non-whitelisted Country Login Detection and Prevention
Child links: TRB-010 TCER: RADAR build non-whitelist GeoIP
| Attribute | Value |
|---|---|
| platform | GNU/Linux (Ubuntu+Debian) |
| execution_type | Manual |
| verification_method | T |
| release | alpha |
| complexity | 3 |
| test_data | see referenced files |
| version | 0.5 |
3.4 RADAR: build log volume abnormal growth TST-044
Preconditions and setup actions
- RADAR is setup according to TST-041
Test steps
- The working directory is required to be
radar:
cd radar
- Build RADAR with SCENARIO_NAME log_volume:
./build-radar.sh log_volume --agent remote/local --manager remote/local --manager_exists true/false
In this step, please choose options according to your setup:
-
--agentWhere agents live: local (docker-compose.agents.yml) | remote (SSH endpoints) -
--managerWhere manager lives: local (docker-compose.core.yml) | remote (SSH host) -
--manager_existsWhether the manager already exists at that location:- true : do not bootstrap a manager
- false : bootstrap a manager
-
--ssh-keyOptional: path to the SSH private key used for remote manager/agent access. If not provided, defaults to:$HOME/.ssh/id_ed25519
- To clean up the test environment only after a successful test execution AND a successful execution of TST-046:
- In case the manager is chosen to be
local, in the controller node/host, run these commands:
./stop-radar.sh --all
docker compose -f docker-compose.webhook.yml down -v
- In case the manager is chosen to be
remoteand bootstrapped, in the manager endpoint, run these commands to clean up the test environment:
cd /tmp/radar_mgr_XXXXXXX
ls docker-compose.core.yml
./stop-radar.sh --all
docker compose -f docker-compose.webhook.yml down -v
cd /tmp
rm -rf radar_mgr_*
Each Ansible run creates a staging directory in the endpoint where the manager is bootstrapped. The successful run directory (starts with radar_mgr_ ending with a random identifier XXXXXXX) should be checked for the existence of a Docker Compose file and then cleaned.
- In case the agent is chosen to be
local, in the controller node/host, run this command:
docker compose -f docker-compose.agents.yml down -v
Expected outcome
- Check the setup:
2. Check the setup
In Wazuh Manager
Connect to the Wazuh manager to be able to perform the following verifications:
docker exec -it wazuh.manager bash
- 2.1 RADAR snippet for log_volume is present in ossec.conf
grep -n 'RADAR: log_volume' /var/ossec/etc/ossec.conf
to check ossec.conf contains a RADAR: log_volume BEGIN/END block with the log_volume-related settings.
- 2.2 RADAR decoders for log_volume exist
grep -n 'RADAR_DECODERS: log_volume' /var/ossec/etc/decoders/local_decoder.xml
to check local_decoder.xml contains a RADAR_DECODERS: log_volume block defining decoders that produce a log_bytes field.
- 2.3 RADAR rules for log_volume exist
grep -n 'RADAR_RULES: log_volume' /var/ossec/etc/rules/local_rules.xml
too check local_rules.xml contains a RADAR_RULES: log_volume block with rules using log_bytes for anomaly detection.
- 2.4 OpenSearch template radar-log-volume is present
curl -u "$OS_USER:$OS_PASS" -k "$OS_URL/_index_template/radar-log-volume?pretty"
to ensure HTTP status is 200 and the template JSON exists with mappings for log_bytes as a numeric type.
- 2.5 log_volume rules are bound to active responses
grep -A5 'email_ar' /var/ossec/etc/ossec.conf
to check Log volume anomaly rule ID(s) reference email_ar.py as intended.
In endpoints running agents
- 2.6 RADAR helper directory and script are installed on the SSH agent host.
ls -ld /opt/radar
ls -l /opt/radar/radar-helper.py
to check /opt/radar exists with mode 0755 and owner root:root; radar-helper.py exists with mode 0750 and owner root:root.
- 2.7
radar-helper.servicesystemd unit is installed, enabled, and running.
systemctl status radar-helper.service
to check that the service is active.
- 2.8 Agent
ossec.confon agent includes thelog_volumeRADAR snippet.
grep -n 'RADAR' /var/ossec/etc/ossec.conf
to check /var/ossec/etc/ossec.conf exists with owner root:wazuh, mode 0640, and contains a RADAR: log_volume BEGIN/END block inserted before </ossec_config>.
- 2.9 Wazuh agent service is running on SSH agents after restart.
/var/ossec/bin/wazuh-control status
to check status output indicates the agent is running with no error messages.
Post-test cleanup
- 3 Check the cleanup after successful validations, the command output should be empty:
docker ps
Parent links: SRS-056 Log volume spike detection per endpoint
Child links: TRB-011 TCER: RADAR build log volume growth
| Attribute | Value |
|---|---|
| platform | GNU/Linux (Ubuntu+Debian) |
| execution_type | Manual |
| verification_method | T |
| release | alpha |
| complexity | 2 |
| test_data | see referenced files |
| version | 0.5 |
3.5 Run RADAR for log volume abnormal growth TST-045
Preconditions and setup actions
- RADAR is built according to the scenario TST-044.
Test steps
- The working directory is required to be
radar:
cd radar
- After building the scenario, wait about 3 minutes for index creation and correct mapping. Then, run RADAR with SCENARIO_NAME log_volume
./run-radar.sh log_volume
Expected outcome
-
In Wazuh Dashboard:
2.1. The detector
LOG_VOLUME_DETECTORis created in Wazuh Dashboard with the correct configurations. In Anomaly Detection menu the created detector should be visible. The correct configurations can be found inconfig.yamlunderlog_volumekey.2.2. The monitor is created in Wazuh Dashboard with the trigger to the webhook. In Alerting menu created Monitor should be listed under Monitors tab.
Parent links: SRS-056 Log volume spike detection per endpoint
Child links: TRB-012 TCER: Add log volume growth anomaly detector
| Attribute | Value |
|---|---|
| platform | GNU/Linux (Ubuntu+Debian) |
| execution_type | Manual |
| verification_method | T |
| release | alpha |
| complexity | 3 |
| test_data | see referenced files |
| version | 0.5 |
3.6 Suspicious login detection validation TST-046
Preconditions and setup actions
- RADAR is built according to the scenario TST-042.
Test steps
- Paste these logs into
/var/log/auth.log, adjusting the timestamps on the agent so that all entries fall within a one-minute interval:
2025-XX-XXTXX:XX:XX.227122+01:00 edge.vm sshd[1169457]: Failed password for test01 from 8.8.8.8 port 1045 ssh2: ED25519 SHA256:A.
2025-XX-XXTXX:XX:XX.227122+01:00 edge.vm sshd[1169457]: Failed password for test01 from 1.0.136.99 port 1045 ssh2: ED25519 SHA256:A.
2025-XX-XXTXX:XX:XX.227122+01:00 edge.vm sshd[1169457]: Failed password for test01 from 89.31.143.90 port 1045 ssh2: ED25519 SHA256:A.
2025-XX-XXTXX:XX:XX.227122+01:00 edge.vm sshd[1169457]: Failed password for test01 from 47.91.170.222 port 1045 ssh2: ED25519 SHA256:A.
2025-XX-XXTXX:XX:XX.227122+01:00 edge.vm sshd[1169457]: Failed password for test01 from 150.95.255.38 port 1045 ssh2: ED25519 SHA256:A.
2025-XX-XXTXX:XX:XX.227122+01:00 edge.vm sshd[1169457]: Failed password for test01 from 84.32.84.32 port 1045 ssh2: ED25519 SHA256:A.
2025-XX-XXTXX:XX:XX.227122+01:00 edge.vm sshd[1169457]: Accepted publickey for test01 from 8.8.8.8 port 60850 ssh2: ED25519 SHA256:XXXXXXXXXXXXXXXXXXXXXXXXXXXXXXXXXXXXXXXXXXX
For example, the first log line should start 2025-12-06T15:10:20.227122+01:00 and the last line should end with 2025-12-06T15:11:20.227122+01:00, so that the entire sequence remains within a one-minute window.
Expected outcome
- In Wazuh Dashboard Discovery page, the rule ID starting with
210***should be triggered. - The email (
EMAIL_TOfrom.envof TST-041) specified receives an email about the alert.
Child links: TRB-013 TCER: RADAR suspicious login detection
| Attribute | Value |
|---|---|
| platform | GNU/Linux (Ubuntu+Debian) |
| execution_type | Manual |
| verification_method | T |
| release | alpha |
| complexity | 2 |
| test_data | see referenced files |
| version | 0.5 |
3.7 Non-whitelist GeoIP detection validation TST-047
Preconditions and setup actions
- RADAR is built according to the scenario TST-043.
Test steps
- Paste these logs into
/var/log/auth.logwith modification of the date in the agent:
2025-XX-XXTXX:XX:XX.227122+01:00 edge.vm sshd[1169457]: Accepted publickey for test01 from 8.8.8.8 port 60850 ssh2: ED25519 SHA256:XXXXXXXXXXXXXXXXXXXXXXXXXXXXXXXXXXXXXXXXXXX
For example, a single log line starting with 2025-12-06T15:10:20.227122+01:00 edge.vm ...
Expected outcome
- In the Wazuh Dashboard Discovery page, the rule ID starting with
10090*should be triggered. - The email (
EMAIL_TOfrom.envof TST-041) specified receives an email about the alert.
Child links: TRB-014 TCER: RADAR non-whitelist GeoIP detection
| Attribute | Value |
|---|---|
| platform | GNU/Linux (Ubuntu+Debian) |
| execution_type | Manual |
| verification_method | T |
| release | alpha |
| complexity | 2 |
| test_data | see referenced files |
| version | 0.5 |
3.8 Log volume abnormal growth validation TST-048
Preconditions and setup actions
- RADAR is built according to the scenario TST-045.
Test steps
- After starting detector, 30 minutes should be passed for normalizing the training to insert a spike. To insert a spike, in Wazuh Dashboard -> Indexer Management -> Dev Tools, run this query with adapting the timestamp:
POST wazuh-ad-log-volume-XXXX.XX.XX/_doc
{
  "@timestamp": "XXXX-XX-XXTXX:XX:00.000Z",
  "data": {
    "log_path": "/var/log",
    "log_bytes": 63210547182
  },
  "agent": { "name": "edge.vm" },
  "manager": { "name": "wazuh.manager" },
  "predecoder": {"program_name": "log_volume_metric"}
}
Expected outcome
- In the Wazuh Dashboard Discovery page, the rule ID starting with
100309should be triggered. - The email (
EMAIL_TOfrom.envof TST-041) specified receives an email about the alert.
Child links: TRB-015 TCER: RADAR log volume growth anomaly detector
| Attribute | Value |
|---|---|
| platform | GNU/Linux (Ubuntu+Debian) |
| execution_type | Manual |
| verification_method | T |
| release | alpha |
| complexity | 2 |
| test_data | see referenced files |
| version | 0.5 |
3.9 Setup RADAR foundation v0.7 TST-049
Preconditions and setup actions
- A test controller host/node is available:
- A Linux machine/VM (the Ansible control node) is available to the tester.
- OS: recent GNU/Linux distribution, preferably an Ubuntu distribution (22.04+).
- A second test node (accessible via the controller node) is available: GNU/Linux distro e.g. Debian GNU/Linux 13 (trixie)
- Ansible is installed on the controller host:
- Location: install Ansible only on the controller node.
- Installation reference:
- if
pipxis available, follow the instruction` in Ansible Installation Documentation using pipx. - otherwise, follow the official instructions for Linux distributions.
- Minimum version: Ansible
2.15+.
- if
- Targeted Wazuh manager and agent versions:
4.14.1 - Environment values such as
OS_URL,OS_USER,OS_PASS,DASHBOARD_URL,DASHBOARD_USER,DASHBOARD_PASSand SMTP credentials are available to the tester. The tester has network access (SSH) from the test controller node to controlled endpoints. - If either the Wazuh agent (aka agent) or the Wazuh manager (aka manager) is chosen to be
remote:- the remote agent/manager needs to have Docker and Docker Compose installed following the official documentations for Docker and Docker Compose.
- an available user in remote agent or manager with sudo access, and tester needs to have SSH access to the user from test controller host.
- If the agents are to be deployed on
remotenodes, the Wazuh agents must be installed in the monitored endpoints using the official documentation. - The agent must be registered with the Wazuh manager following the official documentation.
Test steps
- In the controller host, the working directory is required to be
radar:
cd radar
- Set
.envfile with required variables:
# =======================
# OpenSearch Configuration
# =======================
OS_URL=https://192.168.5.4:9200  # Change accordingly
OS_USER=admin
OS_PASS=SecretPassword
OS_VERIFY_SSL="/app/config/wazuh_indexer_ssl_certs/root-ca.pem"

DASHBOARD_URL=https://192.168.5.4  # Change accordingly
DASHBOARD_USER=admin
DASHBOARD_PASS=SecretPassword
DASHBOARD_VERIFY_SSL="/app/config/wazuh_indexer_ssl_certs/root-ca.pem"

WAZUH_API_URL=https://192.168.5.4:55000  # Change accordingly
WAZUH_AUTH_USER=wazuh-wui
WAZUH_AUTH_PASS=MyS3cr37P450r.*-

WAZUH_AGENT_VERSION=4.14.1-1
WAZUH_MANAGER_ADDRESS=192.168.5.4  # Change accordingly

WEBHOOK_NAME="RADAR_Webhook"
WEBHOOK_URL=http://192.168.5.4:8080/notify  # Change accordingly

# =======================
# Logging
# =======================

AR_LOG_FILE=/var/ossec/logs/active-responses.log

# =======================
# SMTP
# =======================

SMTP_HOST=SMTP_HOST # Change accordingly
SMTP_PORT=SMTP_PORT # Change accordingly
SMTP_USER=SMTP_USER # Change accordingly
SMTP_PASS=SMTP_PASS # Change accordingly
EMAIL_TO=RECEIVER_EMAIL@example.com # Change accordingly
SMTP_STARTTLS=yes
-
In case either the agent or the manager is remote:
3.1. Change
inventory.yamlbased on remote agent/manager data, user credentials and docker container names. Change is needed:- for remote agents, the endpoint part
wazuh_agents_sshmust be configured. - for a remote manager, the endpoint part
wazuh_manager_sshmust be configured. - in each of the above two, you may need to define a
ansible_ssh_private_key_file: <path-to-ssh-key>attribute (to enable access from the control node to the controlled node)
3.2. Create a vault for each host in
inventory.yaml(IMPORTANT: the vault name and host name must match):- for remote agents:
ansible-vault create host_vars/edge.vm.yml - for remote manager:
ansible-vault create host_vars/mgr.remote.yml
3.3. Assign a vault password and set sudo password:
ansible_become_password: <selected-user-sudo-password> - for remote agents, the endpoint part
-
Existence of Wazuh manager on targeted endpoint (local/remote) (signaled via
manager_existsflag used bybuild-radar.sh):4.1. In case the manager does not exist, certificates must be issued matching the
MANAGER_IPandINDEXER_IPaccording to the documentation inconfig/wazuh_indexer_ssl_certs/README.md; in short, once you have adaptedconfig/certs.ymlaccording to your endpoints (IP address and container name), from within theconfigfolder, rundocker run --rm -it -v "PWD/certs.yml:/config/certs.yml:ro"−v"PWD/certs.yml:/config/certs.yml:ro" -v "PWD/certs.yml:/config/certs.yml:ro"−v"PWD/wazuh_indexer_ssl_certs:/certificates" wazuh/wazuh-certs-generator:0.0.24.2. If the manager is already in place, certificates must be copied into
config/wazuh_indexer_ssl_certs.
Expected outcome
-
In the controller host, the vaults are created and SSH access is set correctly:
- if the agent is chosen to be remote:
3.1 The vault is created and exists in
host_vars/:ansible-vault view host_vars/edge.vm.yml3.2 Ansible reaches the SSH group:
ansible -i inventory.yaml wazuh_agents_ssh -m ping --ask-vault-pass- if the manager is chosen to be remote:
3.1 The vault is created and exists in
host_vars/:ansible-vault view host_vars/mgr.remote.yml3.2 Ansible reaches the SSH group:
ansible -i inventory.yaml wazuh_manager_ssh -m ping --ask-vault-pass -
The certificates are available under
config/wazuh_indexer_ssl_certs/:
ls config/wazuh_indexer_ssl_certs/
Child links: TRB-016 TCER: Setup RADAR foundation
| Attribute | Value |
|---|---|
| platform | GNU/Linux (Ubuntu+Debian) |
| execution_type | Manual |
| verification_method | T |
| release | alpha |
| complexity | 3 |
| test_data | see referenced files |
| version | 0.7 |
3.10 RADAR: build suspicious login TST-050
Preconditions and setup actions
- RADAR is setup according to TST-049
Test steps
- In the controller host, the working directory is required to be
radar:
cd radar
- Build RADAR with SCENARIO_NAME suspicious_login, if
managerislocalthen the command should be run withsudo:
./build-radar.sh suspicious_login --agent remote/local --manager remote/local --manager_exists true/false
In this step, please choose options according to your setup:
-
--agentWhere agents live: local (docker-compose.agents.yml) | remote (SSH endpoints) -
--managerWhere manager lives: local (docker-compose.core.yml) | remote (SSH host) -
--manager_existsWhether the manager already exists at that location:- true : do not bootstrap a manager
- false : bootstrap a manager
-
--ssh-keyOptional: path to the SSH private key used for remote manager/agent access. If not provided, defaults to:$HOME/.ssh/id_ed25519
- To clean up the test environment only after a successful test execution AND a successful execution of TST-054:
- In case the manager is chosen to be
local, in the controller node/host, run these commands:
./stop-radar.sh --manager local
- In case the manager is chosen to be
remoteand bootstrapped, in the controller node/host, run these commands:
./stop-radar.sh --manager remote
- In case the agent is chosen to be
local, in the controller node/host, run this command:
./stop-radar.sh --agent local
- In case the agent is chosen to be
remote, in the controller node/host, run this command:
./stop-radar.sh --agent remote
Expected outcome
2. Check the setup
In Wazuh Manager
Connect to the Wazuh manager to be able to perform the following verifications:
docker exec -it wazuh.manager bash
- 2.1 Custom
0310 SSHdecoder deployed; verify this by running
ls -l /var/ossec/etc/decoders/0310-ssh.xml
to ensure that 0310-ssh.xml exists, and is owned by root:wazuh, mode 0640.
- 2.2 Custom
0310 SSHdecoder should contain the decoderssshd-*-with-radar(e.g., including RADAR fields likeASN,country,geo_velocity)
tail -n20 /var/ossec/etc/decoders/0310-ssh.xml
to ensure that RADAR enrichment fields will be parsed.
- 2.3 Default
0310 decoderis excluded inossec.conf; verify via
grep '<decoder_exclude>0310-ssh_decoders.xml</decoder_exclude>' /var/ossec/etc/ossec.conf
to ensure that a <decoder_exclude>0310-ssh_decoders.xml</decoder_exclude> line appears (ideally once) under <ruleset>.
- 2.4 RADAR rules for suspicious_login are in
/var/ossec/etc/rules/; verify via
ls -al /var/ossec/etc/rules/ | grep "suspicious-login"
to ensure rules for suspicious login exists.
- 2.5 Suspicious login rules are bound to active responses; verify via
grep -A5 'radar_ar' /var/ossec/etc/ossec.conf
to ensure that suspicious login rule ID(s) references the intended <group>, <options> or <active-response> that trigger radar_ar.py.
- 2.6 Agent is registered with the manager; verify via
/var/ossec/bin/agent_control -l
to ensure that an entry exists for each agent.
- 2.7 Agent configurations are in place; verify via
cat /var/ossec/etc/shared/default/agent.conf | grep "suspicious_login"
to ensure that agent configurations for suspicious login exists.
- 2.8 Wazuh Manager is running after restart; verify via
/var/ossec/bin/wazuh-control status
to ensure that status output indicates the manager is running with no error messages.
In endpoints running agents
- 2.9 RADAR helper directory and script are installed on the SSH agent host; verify via
ls -ld /opt/radar
ls -l /opt/radar/radar-helper.py
to ensure /opt/radar exists with mode 0755 and owner root:root; radar-helper.py exists with mode 0750 and owner root:root.
- 2.10
radar-helper.servicesystemd unit is installed, enabled, and running; verify via
systemctl status radar-helper.service
to ensure the service is active.
Post-test cleanup
- 3 Check the cleanup after successful validations, the command output should be empty:
docker ps
Parent links: SRS-051 Suspicious login Detection and Prevention: Impossible travel and Failed-login bursts
Child links: TRB-017 TCER: RADAR build suspicious login
| Attribute | Value |
|---|---|
| platform | GNU/Linux (Ubuntu+Debian) |
| execution_type | Manual |
| verification_method | T |
| release | alpha |
| complexity | 3 |
| test_data | see referenced files |
| version | 0.7 |
3.11 RADAR: build non-whitelist GeoIP detection TST-051
Preconditions and setup actions
- RADAR is setup according to TST-049
Test steps
- In the controller host, the working directory is required to be
radar:
cd radar
- Build RADAR with SCENARIO_NAME geoip_detection, if
managerislocalthen the command should be run withsudo:
./build-radar.sh geoip_detection --agent remote/local --manager remote/local --manager_exists true/false
In this step, please choose options according to your setup:
-
--agentWhere agents live: local (docker-compose.agents.yml) | remote (SSH endpoints) -
--managerWhere manager lives: local (docker-compose.core.yml) | remote (SSH host) -
--manager_existsWhether the manager already exists at that location:- true : do not bootstrap a manager
- false : bootstrap a manager
-
--ssh-keyOptional: path to the SSH private key used for remote manager/agent access. If not provided, defaults to:$HOME/.ssh/id_ed25519
- To clean up the test environment only after a successful test execution AND a successful execution of TST-055:
- In case the manager is chosen to be
local, in the controller node/host, run these commands:
./stop-radar.sh --manager local
- In case the manager is chosen to be
remoteand bootstrapped, in the controller node/host, run these commands:
./stop-radar.sh --manager remote
- In case the agent is chosen to be
local, in the controller node/host, run this command:
./stop-radar.sh --agent local
- In case the agent is chosen to be
remote, in the controller node/host, run this command:
./stop-radar.sh --agent remote
Expected outcome
2. Check the setup
In Wazuh Manager
Connect to the Wazuh manager to be able to perform the following verifications:
docker exec -it wazuh.manager bash
- 2.1 Whitelist file exists
ls -l /var/ossec/etc/lists/whitelist_countries
to ensure that /var/ossec/etc/lists/whitelist_countries exists, its contents match the scenario’s whitelist_countries, and its owner is root:wazuh, with mode 0664.
- 2.2
ossec.confhas<list>entry forwhitelist_countries
grep -n 'whitelist_countries' /var/ossec/etc/ossec.conf
to ensure under <ruleset>, there is a <list>...whitelist_countries</list> entry with the RADAR marker for geoip_detection.
- 2.3 Custom
0310 SSHdecoder deployed; verify this by running
ls -l /var/ossec/etc/decoders/0310-ssh.xml
to ensure that 0310-ssh.xml exists, and is owned by root:wazuh, mode 0640.
- 2.4 Default
0310 decoderis excluded inossec.conf; verify via
grep '<decoder_exclude>0310-ssh_decoders.xml</decoder_exclude>' /var/ossec/etc/ossec.conf
to ensure that a <decoder_exclude>0310-ssh_decoders.xml</decoder_exclude> line appears (ideally once) under <ruleset>.
- 2.5 RADAR rules for
geoip_detectionexist
ls -al /var/ossec/etc/rules/ | grep "geoip-detection"
to ensure rules for geoip detection exists.
- 2.6 GeoIP non-whitelist rules are bound to active responses
grep -A10 'radar_ar' /var/ossec/etc/ossec.conf
to check GeoIP non-whitelist rule ID(s) reference the correct <active-response>.
- 2.7 Agent configurations are in place; verify via
cat /var/ossec/etc/shared/default/agent.conf | grep "suspicious_login"
to ensure that agent configurations for geoip detection exists.
In endpoints running agents
- 2.8 RADAR helper directory and script are installed on the SSH agent host.
ls -ld /opt/radar
ls -l /opt/radar/radar-helper.py
to check /opt/radar exists with mode 0755 and owner root:root; radar-helper.py exists with mode 0750 and owner root:root.
- 2.9
radar-helper.servicesystemd unit is installed, enabled, and running.
systemctl status radar-helper.service
to check that the service is active.
Post-test cleanup
- 3 Check the cleanup after successful validations, the command output should be empty:
docker ps
Parent links: SRS-055 Geo-based Access Control: Non-whitelisted Country Login Detection and Prevention
Child links: TRB-018 TCER: RADAR build non-whitelist GeoIP
| Attribute | Value |
|---|---|
| platform | GNU/Linux (Ubuntu+Debian) |
| execution_type | Manual |
| verification_method | T |
| release | alpha |
| complexity | 3 |
| test_data | see referenced files |
| version | 0.7 |
3.12 RADAR: build log volume abnormal growth TST-052
Preconditions and setup actions
- RADAR is setup according to TST-049
Test steps
- The working directory is required to be
radar:
cd radar
- Build RADAR with SCENARIO_NAME log_volume, if
managerislocalthen the command should be run withsudo:
./build-radar.sh log_volume --agent remote/local --manager remote/local --manager_exists true/false
In this step, please choose options according to your setup:
-
--agentWhere agents live: local (docker-compose.agents.yml) | remote (SSH endpoints) -
--managerWhere manager lives: local (docker-compose.core.yml) | remote (SSH host) -
--manager_existsWhether the manager already exists at that location:- true : do not bootstrap a manager
- false : bootstrap a manager
-
--ssh-keyOptional: path to the SSH private key used for remote manager/agent access. If not provided, defaults to:$HOME/.ssh/id_ed25519
- To clean up the test environment only after a successful test execution AND a successful execution of TST-056:
- In case the manager is chosen to be
local, in the controller node/host, run these commands:
./stop-radar.sh --manager local
- In case the manager is chosen to be
remoteand bootstrapped, in the controller node/host, run these commands:
./stop-radar.sh --manager remote
- In case the agent is chosen to be
local, in the controller node/host, run this command:
./stop-radar.sh --agent local
- In case the agent is chosen to be
remote, in the controller node/host, run this command:
./stop-radar.sh --agent remote
Expected outcome
- Check the setup:
2. Check the setup
In Wazuh Manager
Connect to the Wazuh manager to be able to perform the following verifications:
docker exec -it wazuh.manager bash
- 2.1 RADAR snippet for log_volume is present in ossec.conf
grep -n 'RADAR: log_volume' /var/ossec/etc/ossec.conf
to check ossec.conf contains a RADAR: log_volume BEGIN/END block with the log_volume-related settings.
- 2.2 RADAR decoders for log_volume exist
ls -al /var/ossec/etc/decoders/ | grep "log-volume"
to check decoders for log volume are in place.
- 2.3 RADAR rules for log_volume exist
ls -al /var/ossec/etc/rules/ | grep "log-volume"
to check rules for log volume are in place.
- 2.4 OpenSearch template radar-log-volume is present
curl -u "$OS_USER:$OS_PASS" -k "$OS_URL/_index_template/radar-log-volume?pretty"
to ensure HTTP status is 200 and the template JSON exists with mappings for log_bytes as a numeric type.
- 2.5 log_volume rules are bound to active responses
grep -A5 'radar_ar' /var/ossec/etc/ossec.conf
to check Log volume anomaly rule ID(s) reference radar_ar.py as intended.
- 2.6 Agent configurations are in place; verify via
cat /var/ossec/etc/shared/default/agent.conf | grep "log_volume_metric"
to ensure that agent configurations for log volume exists.
In endpoints running agents
- 2.7 RADAR helper directory and script are installed on the SSH agent host.
ls -ld /opt/radar
ls -l /opt/radar/radar-helper.py
to check /opt/radar exists with mode 0755 and owner root:root; radar-helper.py exists with mode 0750 and owner root:root.
- 2.8
radar-helper.servicesystemd unit is installed, enabled, and running.
systemctl status radar-helper.service
to check that the service is active.
Post-test cleanup
- 3 Check the cleanup after successful validations, the command output should be empty:
docker ps
Parent links: SRS-056 Log volume spike detection per endpoint
Child links: TRB-019 TCER: RADAR build log volume growth
| Attribute | Value |
|---|---|
| platform | GNU/Linux (Ubuntu+Debian) |
| execution_type | Manual |
| verification_method | T |
| release | alpha |
| complexity | 2 |
| test_data | see referenced files |
| version | 0.7 |
3.13 Run RADAR for log volume abnormal growth TST-053
Preconditions and setup actions
- RADAR is built according to the scenario TST-052.
Test steps
- The working directory is required to be
radar:
cd radar
- After building the scenario, wait about 3 minutes for index creation and correct mapping. Then, run RADAR with SCENARIO_NAME log_volume
./run-radar.sh log_volume
Expected outcome
-
In Wazuh Dashboard:
2.1. The detector
LOG_VOLUME_DETECTORis created in Wazuh Dashboard with the correct configurations. In Anomaly Detection menu the created detector should be visible. The correct configurations can be found inconfig.yamlunderlog_volumekey.2.2. The monitor is created in Wazuh Dashboard with the trigger to the webhook. In Alerting menu created Monitor should be listed under Monitors tab.
Parent links: SRS-056 Log volume spike detection per endpoint
Child links: TRB-020 TCER: Add log volume growth anomaly detector
| Attribute | Value |
|---|---|
| platform | GNU/Linux (Ubuntu+Debian) |
| execution_type | Manual |
| verification_method | T |
| release | alpha |
| complexity | 3 |
| test_data | see referenced files |
| version | 0.7 |
3.14 Suspicious login detection validation TST-054
Preconditions and setup actions
- RADAR is built according to the scenario TST-050.
Test steps
- Paste these logs into
/var/log/auth.log, adjusting the timestamps on the agent so that all entries fall within a one-minute interval:
2025-XX-XXTXX:XX:XX.227122+01:00 edge.vm sshd[1169457]: Failed password for test01 from 8.8.8.8 port 1045 ssh2: ED25519 SHA256:A.
2025-XX-XXTXX:XX:XX.227122+01:00 edge.vm sshd[1169457]: Failed password for test01 from 1.0.136.99 port 1045 ssh2: ED25519 SHA256:A.
2025-XX-XXTXX:XX:XX.227122+01:00 edge.vm sshd[1169457]: Failed password for test01 from 89.31.143.90 port 1045 ssh2: ED25519 SHA256:A.
2025-XX-XXTXX:XX:XX.227122+01:00 edge.vm sshd[1169457]: Failed password for test01 from 47.91.170.222 port 1045 ssh2: ED25519 SHA256:A.
2025-XX-XXTXX:XX:XX.227122+01:00 edge.vm sshd[1169457]: Failed password for test01 from 150.95.255.38 port 1045 ssh2: ED25519 SHA256:A.
2025-XX-XXTXX:XX:XX.227122+01:00 edge.vm sshd[1169457]: Failed password for test01 from 84.32.84.32 port 1045 ssh2: ED25519 SHA256:A.
2025-XX-XXTXX:XX:XX.227122+01:00 edge.vm sshd[1169457]: Accepted publickey for test01 from 8.8.8.8 port 60850 ssh2: ED25519 SHA256:XXXXXXXXXXXXXXXXXXXXXXXXXXXXXXXXXXXXXXXXXXX
For example, the first log line should start 2025-12-06T15:10:20.227122+01:00 and the last line should end with 2025-12-06T15:11:20.227122+01:00, so that the entire sequence remains within a one-minute window.
Expected outcome
- In Wazuh Dashboard Discovery page, the rule ID starting with
210***should be triggered. - The email (
EMAIL_TOfrom.envof TST-049) specified receives an email about the alert.
Child links: TRB-021 TCER: RADAR suspicious login detection
| Attribute | Value |
|---|---|
| platform | GNU/Linux (Ubuntu+Debian) |
| execution_type | Manual |
| verification_method | T |
| release | alpha |
| complexity | 2 |
| test_data | see referenced files |
| version | 0.7 |
3.15 Non-whitelist GeoIP detection validation TST-055
Preconditions and setup actions
- RADAR is built according to the scenario TST-051.
Test steps
- Paste these logs into
/var/log/auth.logwith modification of the date in the agent:
2025-XX-XXTXX:XX:XX.227122+01:00 edge.vm sshd[1169457]: Accepted publickey for test01 from 8.8.8.8 port 60850 ssh2: ED25519 SHA256:XXXXXXXXXXXXXXXXXXXXXXXXXXXXXXXXXXXXXXXXXXX
For example, a single log line starting with 2025-12-06T15:10:20.227122+01:00 edge.vm ...
Expected outcome
- In the Wazuh Dashboard Discovery page, the rule ID starting with
10090*should be triggered. - The email (
EMAIL_TOfrom.envof TST-049) specified receives an email about the alert.
Child links: TRB-022 TCER: RADAR non-whitelist GeoIP detection
| Attribute | Value |
|---|---|
| platform | GNU/Linux (Ubuntu+Debian) |
| execution_type | Manual |
| verification_method | T |
| release | alpha |
| complexity | 2 |
| test_data | see referenced files |
| version | 0.7 |
3.16 Log volume abnormal growth validation TST-056
Preconditions and setup actions
- RADAR is built according to the scenario TST-053.
Test steps
- After starting detector, 30 minutes should be passed for normalizing the training to insert a spike. To insert a spike, in Wazuh Dashboard -> Indexer Management -> Dev Tools, run this query with adapting the timestamp:
POST wazuh-ad-log-volume-XXXX.XX.XX/_doc
{
  "@timestamp": "XXXX-XX-XXTXX:XX:00.000Z",
  "data": {
    "log_path": "/var/log",
    "log_bytes": 63210547182
  },
  "agent": { "name": "edge.vm" },
  "manager": { "name": "wazuh.manager" },
  "predecoder": {"program_name": "log_volume_metric"}
}
Expected outcome
- In the Wazuh Dashboard Discovery page, the rule ID starting with
100309should be triggered. - The email (
EMAIL_TOfrom.envof TST-049) specified receives an email about the alert.
Child links: TRB-023 TCER: RADAR log volume growth anomaly detector
| Attribute | Value |
|---|---|
| platform | GNU/Linux (Ubuntu+Debian) |
| execution_type | Manual |
| verification_method | T |
| release | alpha |
| complexity | 2 |
| test_data | see referenced files |
| version | 0.7 |
3.17 RADAR FlowIntel case creation via Active Response TST-057
Preconditions and setup actions
- A test controller host/node is available:
- A Linux machine/VM (the Ansible control node) is available to the tester.
- OS: recent GNU/Linux distribution, preferably an Ubuntu distribution (22.04+).
- A second test node (accessible via the controller node) is available: GNU/Linux distro e.g. Debian GNU/Linux 13 (trixie)
- Ansible is installed on the controller host:
- Location: install Ansible only on the controller node.
- Installation reference:
- if
pipxis available, follow the instruction` in Ansible Installation Documentation using pipx. - otherwise, follow the official instructions for Linux distributions.
- Minimum version: Ansible
2.15+.
- if
- Targeted Wazuh manager and agent versions:
4.14.1 - A Flowintel instance is running and there is a connection between Flowintel and the Wazuh Manager. To bring up the supporting services for the Flowintel integration, follow the DECIPHER deployment guide to bring up Flowintel:. To enable the connection, configure the
FLOWINTEL_*variables in.env. - Environment values such as
OS_URL,OS_USER,OS_PASS,DASHBOARD_URL,DASHBOARD_USER,DASHBOARD_PASSand SMTP credentials are available to the tester. The tester has network access (SSH) from the test controller node to controlled endpoints. - If either the Wazuh agent (aka agent) or the Wazuh manager (aka manager) is chosen to be
remote:- the remote agent/manager needs to have Docker and Docker Compose installed following the official documentations for Docker and Docker Compose.
- an available user in remote agent or manager with sudo access, and tester needs to have SSH access to the user from test controller host.
- If the agents are to be deployed on
remotenodes, the Wazuh agents must be installed in the monitored endpoints using the official documentation. - The agent must be registered with the Wazuh manager following the official documentation.
Test steps
- In the controller host, the working directory is required to be
radar:
cd radar
- Set
.envfile with required variables:
# =======================
# OpenSearch Configuration
# =======================
OS_URL=https://192.168.5.4:9200  # Change accordingly
OS_USER=admin
OS_PASS=SecretPassword
OS_VERIFY_SSL="/app/config/wazuh_indexer_ssl_certs/root-ca.pem"

DASHBOARD_URL=https://192.168.5.4  # Change accordingly
DASHBOARD_USER=admin
DASHBOARD_PASS=SecretPassword
DASHBOARD_VERIFY_SSL="/app/config/wazuh_indexer_ssl_certs/root-ca.pem"

WAZUH_API_URL=https://192.168.5.4:55000  # Change accordingly
WAZUH_AUTH_USER=wazuh-wui
WAZUH_AUTH_PASS=MyS3cr37P450r.*-

WAZUH_AGENT_VERSION=4.14.1-1
WAZUH_MANAGER_ADDRESS=192.168.5.4  # Change accordingly

WEBHOOK_NAME="RADAR_Webhook"
WEBHOOK_URL=http://192.168.5.4:8080/notify  # Change accordingly

# =======================
# Logging
# =======================

AR_LOG_FILE=/var/ossec/logs/active-responses.log
AR_RISK_CONFIG=/var/ossec/active-response/bin/ar.yaml

# =======================
# SMTP
# =======================

SMTP_HOST=SMTP_HOST # Change accordingly
SMTP_PORT=SMTP_PORT # Change accordingly
SMTP_USER=SMTP_USER # Change accordingly
SMTP_PASS=SMTP_PASS # Change accordingly
EMAIL_TO=RECEIVER_EMAIL@example.com # Change accordingly
SMTP_STARTTLS=yes

# =======================
# FLOWINTEL
# =======================

FLOWINTEL_BASE_URL=http://192.168.0.28:7006/api  # Change IP accordingly
FLOWINTEL_API_KEY=API_KEY                        # Change accordingly
FLOWINTEL_VERIFY_SSL=VERIFY_SSL                  # Change accordingly
PYFLOWINTEL_PATH=/var/ossec/active-response/bin/pyflowintel
-
In case either the agent or the manager is remote:
3.1. Change
inventory.yamlbased on remote agent/manager data, user credentials and docker container names. Change is needed:- for remote agents, the endpoint part
wazuh_agents_sshmust be configured. - for a remote manager, the endpoint part
wazuh_manager_sshmust be configured. - in each of the above two, you may need to define a
ansible_ssh_private_key_file: <path-to-ssh-key>attribute (to enable access from the control node to the controlled node)
3.2. Create a vault for each host in
inventory.yaml(IMPORTANT: the vault name and host name must match):- for remote agents:
ansible-vault create host_vars/edge.vm.yml - for remote manager:
ansible-vault create host_vars/mgr.remote.yml
3.3. Assign a vault password and set sudo password:
ansible_become_password: <selected-user-sudo-password> - for remote agents, the endpoint part
-
Existence of Wazuh manager on targeted endpoint (local/remote) (signaled via
manager_existsflag used bybuild-radar.sh):4.1. In case the manager does not exist, certificates must be issued matching the
MANAGER_IPandINDEXER_IPaccording to the documentation inconfig/wazuh_indexer_ssl_certs/README.md; in short, once you have adaptedconfig/certs.ymlaccording to your endpoints (IP address and container name), from within theconfigfolder, rundocker run --rm -it -v "PWD/certs.yml:/config/certs.yml:ro"−v"PWD/certs.yml:/config/certs.yml:ro" -v "PWD/certs.yml:/config/certs.yml:ro"−v"PWD/wazuh_indexer_ssl_certs:/certificates" wazuh/wazuh-certs-generator:0.0.24.2. If the manager is already in place, certificates must be copied into
config/wazuh_indexer_ssl_certs.
Expected outcome
-
In the controller host, the vaults are created and SSH access is set correctly:
- if the agent is chosen to be remote:
3.1 The vault is created and exists in
host_vars/:ansible-vault view host_vars/edge.vm.yml3.2 Ansible reaches the SSH group:
ansible -i inventory.yaml wazuh_agents_ssh -m ping --ask-vault-pass- if the manager is chosen to be remote:
3.1 The vault is created and exists in
host_vars/:ansible-vault view host_vars/mgr.remote.yml3.2 Ansible reaches the SSH group:
ansible -i inventory.yaml wazuh_manager_ssh -m ping --ask-vault-pass -
The certificates are available under
config/wazuh_indexer_ssl_certs/:
ls config/wazuh_indexer_ssl_certs/
Child links: TRB-024 TCER: RADAR Flowintel case creation via Active Response
| Attribute | Value |
|---|---|
| platform | GNU/Linux (Ubuntu+Debian) |
| execution_type | Manual |
| verification_method | T |
| release | alpha |
| complexity | 3 |
| test_data | see referenced files |
| version | 0.7 |
3.17 RADAR: build non-whitelist GeoIP detection with case creation TST-058
Preconditions and setup actions
- RADAR is setup according to TST-057
Test steps
- In the controller host, the working directory is required to be
radar:
cd radar
- Build RADAR with SCENARIO_NAME geoip_detection, if
managerislocalthen the command should be run withsudo:
sudo ./build-radar.sh geoip_detection --agent remote/local --manager remote/local --manager_exists true/false
In this step, please choose options according to your setup:
-
--agentWhere agents live: local (docker-compose.agents.yml) | remote (SSH endpoints) -
--managerWhere manager lives: local (docker-compose.core.yml) | remote (SSH host) -
--manager_existsWhether the manager already exists at that location:- true : do not bootstrap a manager
- false : bootstrap a manager
-
--ssh-keyOptional: path to the SSH private key used for remote manager/agent access. If not provided, defaults to:$HOME/.ssh/id_ed25519
- To clean up the test environment only after a successful test execution AND a successful execution of TST-059:
- In case the manager is chosen to be
local, in the controller node/host, run these commands:
./stop-radar.sh --manager local
- In case the manager is chosen to be
remoteand bootstrapped, in the controller node/host, run these commands:
./stop-radar.sh --manager remote
- In case the agent is chosen to be
local, in the controller node/host, run this command:
./stop-radar.sh --agent local
- In case the agent is chosen to be
remote, in the controller node/host, run this command:
./stop-radar.sh --agent remote
Expected outcome
2. Check the setup
In Wazuh Manager
Connect to the Wazuh manager to be able to perform the following verifications:
docker exec -it wazuh.manager bash
- 2.1 Whitelist file exists
ls -l /var/ossec/etc/lists/whitelist_countries
to ensure that /var/ossec/etc/lists/whitelist_countries exists, its contents match the scenario’s whitelist_countries, and its owner is root:wazuh, with mode 0664.
- 2.2
ossec.confhas<list>entry forwhitelist_countries
grep -n 'whitelist_countries' /var/ossec/etc/ossec.conf
to ensure under <ruleset>, there is a <list>...whitelist_countries</list> entry with the RADAR marker for geoip_detection.
- 2.3 Custom
0310 SSHdecoder deployed; verify this by running
ls -l /var/ossec/etc/decoders/0310-ssh.xml
to ensure that 0310-ssh.xml exists, and is owned by root:wazuh, mode 0640.
- 2.4 Default
0310 decoderis excluded inossec.conf; verify via
grep '<decoder_exclude>0310-ssh_decoders.xml</decoder_exclude>' /var/ossec/etc/ossec.conf
to ensure that a <decoder_exclude>0310-ssh_decoders.xml</decoder_exclude> line appears (ideally once) under <ruleset>.
- 2.5 RADAR rules for
geoip_detectionexist
ls -al /var/ossec/etc/rules/ | grep "geoip-detection"
to ensure rules for geoip detection exists.
- 2.6 GeoIP non-whitelist rules are bound to active responses
grep -A10 'radar_ar' /var/ossec/etc/ossec.conf
to check GeoIP non-whitelist rule ID(s) reference the correct <active-response>.
- 2.7 Active response config files are in place
ls -al /var/ossec/active-response/bin/ | grep "ar.yaml"
ls -al /var/ossec/active-response/bin/ | grep "pyflowintel"
to check active response config files are copied.
- 2.8 Agent configurations are in place; verify via
cat /var/ossec/etc/shared/default/agent.conf | grep "suspicious_login"
to ensure that agent configurations for geoip detection exists.
In endpoints running agents
- 2.9 RADAR helper directory and script are installed on the SSH agent host.
ls -ld /opt/radar
ls -l /opt/radar/radar-helper.py
to check /opt/radar exists with mode 0755 and owner root:root; radar-helper.py exists with mode 0750 and owner root:root.
- 2.10
radar-helper.servicesystemd unit is installed, enabled, and running.
systemctl status radar-helper.service
to check that the service is active.
Post-test cleanup
- 3 Check the cleanup after successful validations, the command output should be empty:
docker ps
Parent links: SRS-055 Geo-based Access Control: Non-whitelisted Country Login Detection and Prevention
Child links: TRB-025 TCER: RADAR build non-whitelist GeoIP detection with case creation
| Attribute | Value |
|---|---|
| platform | GNU/Linux (Ubuntu+Debian) |
| execution_type | Manual |
| verification_method | T |
| release | alpha |
| complexity | 3 |
| test_data | see referenced files |
| version | 0.7 |
3.19 Non-whitelist GeoIP detection validation TST-059
Preconditions and setup actions
- RADAR is built according to the scenario TST-058.
Test steps
- Paste these logs into
/var/log/auth.logwith modification of the date in the agent:
2025-XX-XXTXX:XX:XX.227122+01:00 edge.vm sshd[1169457]: Accepted publickey for test01 from 8.8.8.8 port 60850 ssh2: ED25519 SHA256:XXXXXXXXXXXXXXXXXXXXXXXXXXXXXXXXXXXXXXXXXXX
For example, a single log line starting with 2025-12-06T15:10:20.227122+01:00 edge.vm ...
Expected outcome
- In the Wazuh Dashboard Discovery page, the rule ID starting with
10090*should be triggered. - The email (
EMAIL_TOfrom.envof TST-057) specified receives an email about the alert. - The FlowIntel case is created in the
Casesmenu in FlowIntel defined inFLOWINTEL_BASE_URLaddress.
Child links: TRB-026 TCER: RADAR non-whitelist GeoIP detection + Flowintel
| Attribute | Value |
|---|---|
| platform | GNU/Linux (Ubuntu+Debian) |
| execution_type | Manual |
| verification_method | T |
| release | alpha |
| complexity | 2 |
| test_data | see referenced files |
| version | 0.7 |