1.0 ADBox training pipeline SWD-001
The diagram depicts the sequence of operations of the training pipeline, orchestrated by the ADBox Engine.

Parent links: LARC-001 ADBox training pipeline flow
2.0 ADBox prediction pipeline SWD-002
The diagram depicts the sequence of operations in the prediction pipeline, orchestrated by the ADBox Engine.

Parent links: LARC-002 ADBox historical data prediction pipeline flow, LARC-008 ADBox batch and real-time prediction flow
3.0 MTAD-GAT training SWD-003
The diagram depicts the sequence of operations run by the function train_MTAD_GAT of the MTAD_GAT ML-subpackage of ADBox.

Parent links: LARC-009 ADBox machine learning package
4.0 MTAD-GAT prediction SWD-004
MTAD GAT prediction sequence diagram
The diagram depicts the sequence of operations run by the function predict_MTAD_GAT of the MTAD_GAT ML-subpackage of ADBOX.

Parent links: LARC-009 ADBox machine learning package
5.0 Peak-over-threshold (POT) SWD-005
POT evaluation sequence diagram
The diagram depicts the sequence of operations run by the function pot_eval of the MTAD_GAT subpackage of ADBox.
This function runs the dynamic POT (i.e., peak-over-threshold) evaluation.

Parent links: LARC-009 ADBox machine learning package
6.0 ADBox Predictor score computation SWD-006
Predictor score computation sequence diagram
The diagram depicts the sequence of operations run by the function get_score method of the Predictor class in the MTAD GAT PyTorch subpackage of ADBox.

Parent links: LARC-009 ADBox machine learning package
7.0 ADBox MTAD-GAT anomaly prediction SWD-007
ADBox MTAD GAT anomaly prediction sequence diagram
The diagram depicts the sequence of operations run by the function predict_anomalies method of the Predictor class in the MTAD GAT PyTorch subpackage of ADBox.

Parent links: LARC-009 ADBox machine learning package
8.0 ADBox MTAD-GAT Predictor SWD-008
ADBox MTAD GAT Predictor class diagram
The diagram below depicts the Predictor class of the MTAD GAT PyTorch subpackage of ADBox.

Parent links: LARC-009 ADBox machine learning package
9.0 ADBox data managers SWD-009
ADBox data manager class diagrams
The diagram below depicts the Data manager classes of ADBox, all designed and implemented as Singleton classes.

Parent links: LARC-010 ADBox data manager
10 ADBox data transformer SWD-010
ADBox data transformer class diagram
The diagram below depicts the Data Transformer class of ADBox.

Parent links: LARC-003 ADBox preprocessing flow
11 ADBox preprocessing SWD-011
ADBox preprocessing sequence diagram
The diagram summarizes the sequence of actions of the method Preprocessor.preprocessing in the ADBox DataTransformer.

Parent links: LARC-003 ADBox preprocessing flow
12 ADBox TimeManager SWD-012
ADBox time manager class diagrams
The diagram below depicts the Time manager classes of ADBox.
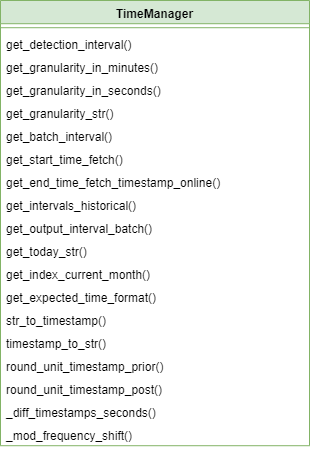
Parent links: LARC-011 ADBox TimeManager
13 ADBox Prediction pipeline's inner body SWD-013
Prediction pipeline sequence diagram
The diagram depicts the sequence of operations in the prediction pipeline body (private method), called by the prediction pipeline.
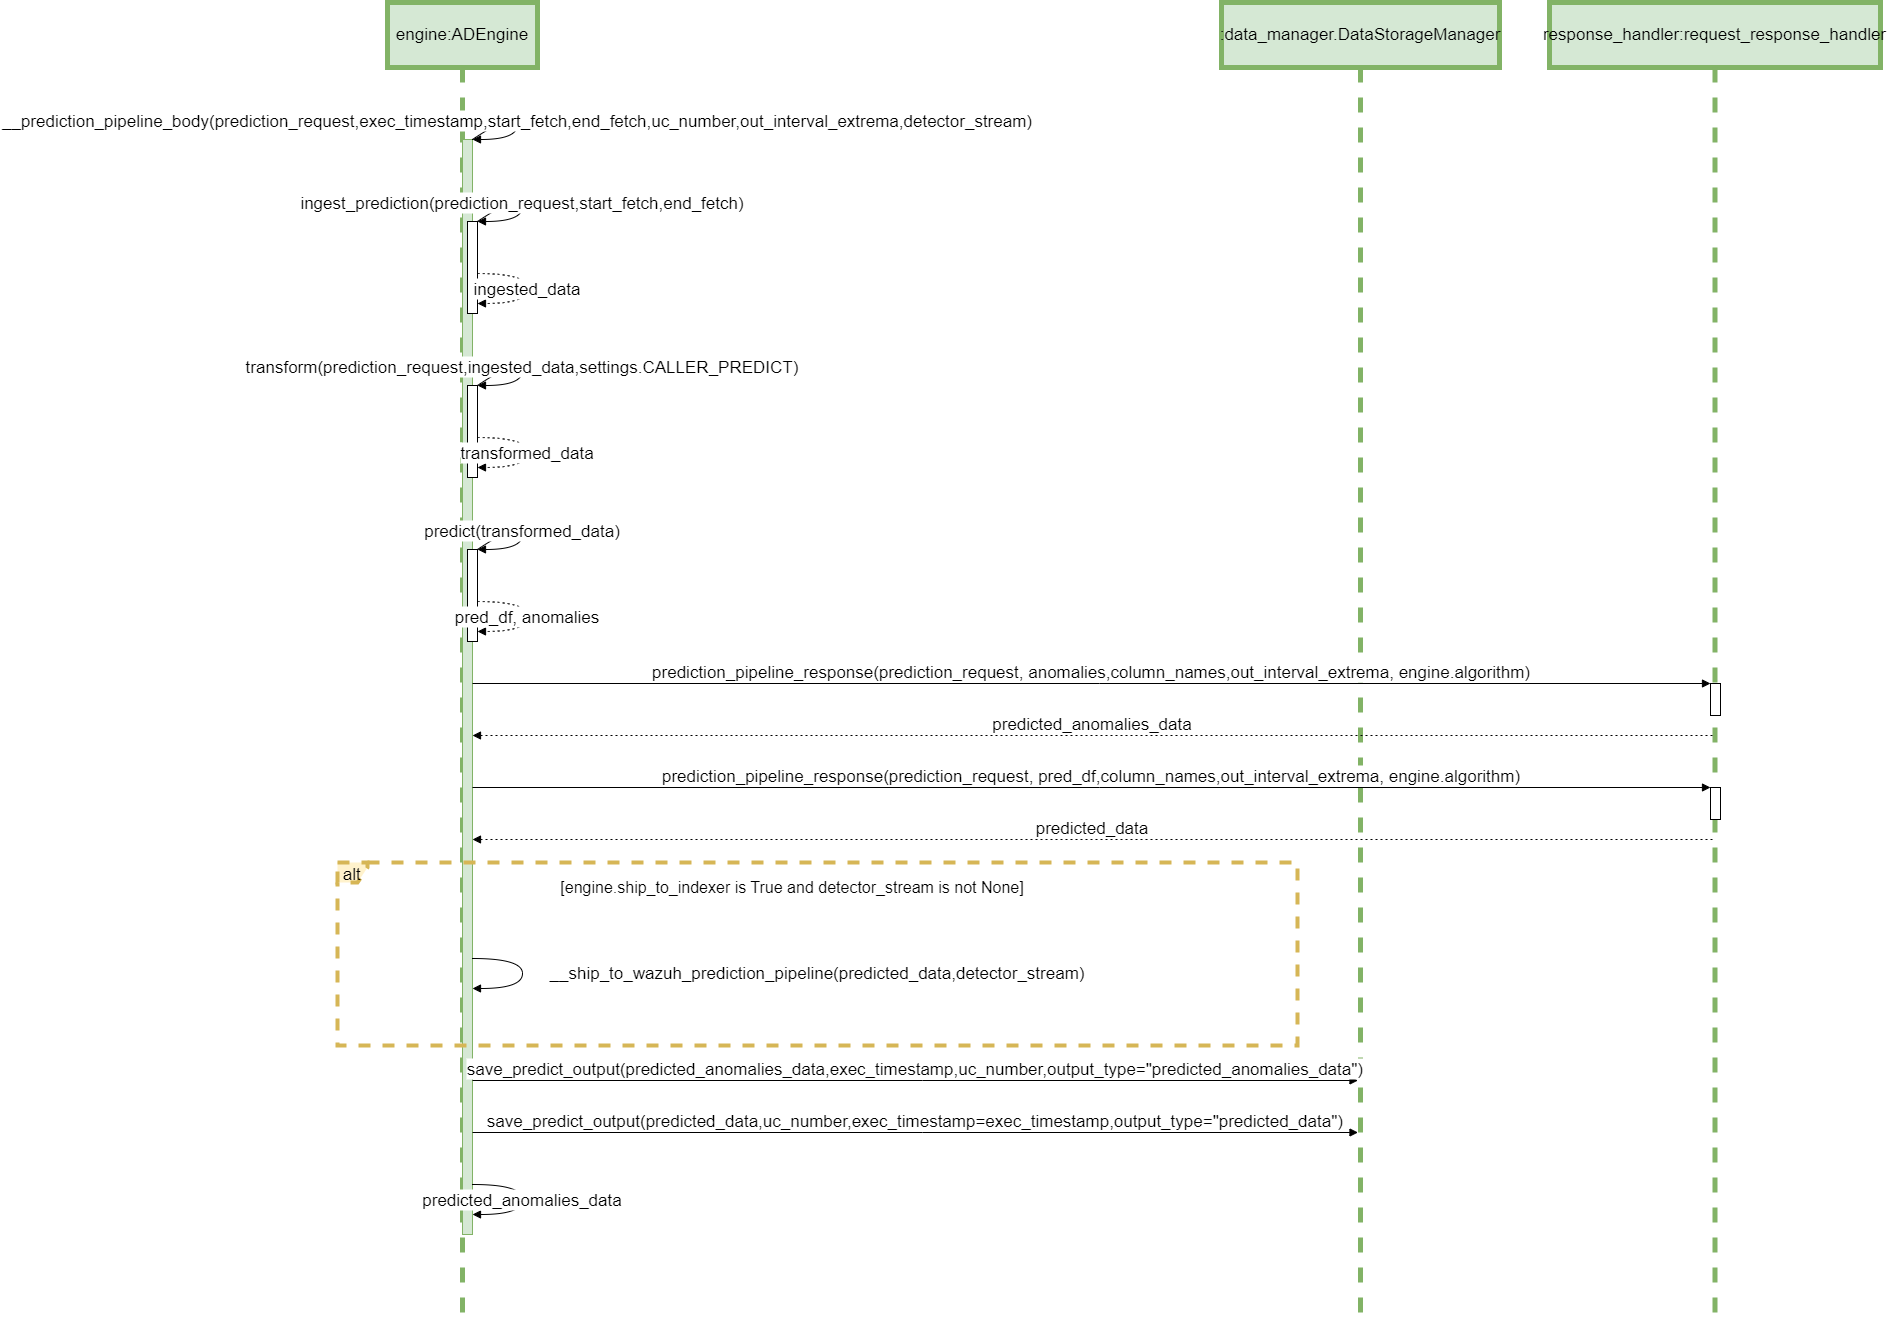
Parent links: LARC-002 ADBox historical data prediction pipeline flow, LARC-008 ADBox batch and real-time prediction flow
14 ADBox config managersactive: true SWD-014
ADBox config manager class diagrams
The diagram below depicts the Config manager classes of ADBox.

Parent links: LARC-012 ADBox ConfigManager
15 ADBox Shipper and Template Handler SWD-015
ADBox Shipper and Template Handler class diagrams
The diagram below depicts the DataShipper,WazuhDataShipper and TamplateHandler classes of ADBox.

Parent links: LARC-014 ADBox Shipper
16 ADBox shipping of prediction data SWD-016
Sequence diagram of ADBox shipping of prediction data
The diagram below depicts the sequence of actions orchestrated by the ADBox Engine when shipping is enabled within the prediction pipeline.

Parent links: LARC-014 ADBox Shipper
17 ADBox creation of a detector stream SWD-017
Sequence diagram of ADBox creation of a detector stream
The diagram below depicts the sequence of actions orchestrated by the ADBox Engine when shipping is enabled within the training pipeline.
Specifically, the __ship_to_wazuh_training_pipeline method which
- creates a detector data stream amd the correspondig templates.
- and can ship the test and training data predictions.

Parent links: LARC-014 ADBox Shipper
18 RATF: ingestion phase SWD-018
Sequence diagram of data ingestion and user setup in RATF
The diagram below depicts the sequence of actions orchestrated by the RADAR Automated Test Framework in ingestion phase, which - bulk ingests the corresponding dataset into Opensearch index. - and for Suspicious Login scenario creates users in Single Sign-On system.

Parent links: LARC-015 RADAR scenario setup flow
19 RATF: setup phase SWD-019
Sequence diagram of environment setup in RATF
The diagram below depicts the sequence of actions orchestrated by the RADAR Automated Test Framework in setup phase, which - sets up Docker environments by copying rules, active responses and setting needed permissions.

Parent links: LARC-015 RADAR scenario setup flow, LARC-016 RADAR active response flow
20 RATF: simulation phase SWD-020
Sequence diagram of threat simulation in RATF
The diagram below depicts the sequence of actions orchestrated by the RADAR Automated Test Framework in simulation phase, which - simulates the threat scenario in corresponding agent - feeds the resulted log to corresponding index in Opensearch.

Parent links: LARC-016 RADAR active response flow
21 RATF: evaluation phase SWD-021
Sequence diagram of metrics evaluation in RATF
The diagram below depicts the sequence of actions orchestrated by the RADAR Automated Test Framework in evaluation phase, which - retrieves the events from corresponding index to scenario - calculates evaluation metrics by comparing with the dataset and simulation results.

Parent links: LARC-016 RADAR active response flow
22 SONAR class structure and relationships SWD-022
Class diagram overview
The SONAR subsystem employs a modular class structure organized around configuration management, data access, and processing pipelines.
Core configuration classes

Scenario management classes

Design patterns
| Pattern | Application | Benefit |
|---|---|---|
| Dataclasses | Configuration objects | Type safety, immutability, validation |
| Factory Method | UseCase.from_yaml() |
Encapsulates YAML parsing logic |
| Strategy | Data providers (Wazuh/Local) | Interchangeable data sources |
| Facade | Engine wrapper | Simplifies MVAD library interface |
Related documentation
- Complete class diagram:
docs/manual/sonar_docs/uml-diagrams.md#class-diagram - Architecture guide:
docs/manual/sonar_docs/architecture.md#module-structure
Parent links: LARC-019 SONAR training pipeline sequence, LARC-020 SONAR detection pipeline sequence
23 SONAR feature engineering design SWD-023
Feature extraction module (features.py)
The feature engineering module transforms raw Wazuh alerts into time-series data suitable for multivariate anomaly detection.
Time-series bucketing algorithm
def bucket_by_time(alerts: List[dict], bucket_minutes: int) -> pd.DataFrame:
    """
    Groups alerts into fixed-size time buckets.

    Algorithm:
    1. Parse timestamps from alerts
    2. Round timestamps to bucket boundaries
    3. Group by bucket timestamp
    4. Aggregate numeric features within each bucket
    5. Return time-indexed DataFrame
    """
Feature types
| Feature Type | Extraction Method | Example Fields |
|---|---|---|
| Numeric | Direct field extraction | rule.level, data.win.eventdata.processId |
| Categorical | Top-K encoding | agent.name, rule.id, data.srcip |
| Aggregated | Count/sum per bucket | Alert count, unique IPs |
| Derived | Computed features | Time-of-day, day-of-week |
Bucketing strategy
Raw Alerts (variable frequency)
    ↓
Time Buckets (fixed intervals: 1, 5, or 10 minutes)
    ↓
Aggregated Features (one row per bucket)
    ↓
Time-Series DataFrame (input to MVAD)
Example bucketing: - Bucket size: 5 minutes - Input: 1000 alerts over 1 hour - Output: 12 rows (one per 5-minute bucket)
Missing data handling
| Scenario | Strategy |
|---|---|
| Empty bucket | Fill with zeros or forward-fill previous value |
| Missing field | Use default value or skip feature |
| Sparse data | Interpolate or flag as anomalous |
Categorical encoding
Top-K frequency encoding: 1. Count occurrences of each categorical value 2. Keep top K most frequent values 3. Map others to "other" category 4. One-hot encode or label encode
Related documentation
- Feature configuration:
docs/manual/sonar_docs/scenario-guide.md - Architecture:
docs/manual/sonar_docs/architecture.md#feature-engineering
Parent links: LARC-019 SONAR training pipeline sequence, LARC-020 SONAR detection pipeline sequence
24 SONAR data shipping design SWD-024
Shipper module architecture
The shipper module (sonar/shipper/) manages the indexing of anomaly detection results to Wazuh data streams.
Component structure
sonar/shipper/
├── __init__.py
├── opensearch_shipper.py       # Main shipper class
├── template_manager.py         # Index template installation
└── bulk_processor.py           # Bulk API operations
Data stream strategy
SONAR uses OpenSearch data streams for time-series storage:
| Data Stream | Purpose | Retention |
|---|---|---|
logs-sonar.anomalies-default |
Anomaly events | 30 days |
logs-sonar.scores-default |
Raw anomaly scores | 7 days |
logs-sonar.metrics-default |
Training/detection metrics | 90 days |
Bulk indexing design
class OpenSearchShipper:
    def ship_anomalies(self, documents: List[dict]) -> BulkResult:
        """
        Ships anomaly documents using bulk API.

        Process:
        1. Validate document structure
        2. Add @timestamp and data_stream fields
        3. Batch into chunks (500 documents/batch)
        4. Execute bulk API request
        5. Handle partial failures
        6. Return success/failure counts
        """
Document format
Each anomaly document includes:
{
  "@timestamp": "2026-02-04T12:00:00Z",
  "event": {
    "kind": "alert",
    "category": ["intrusion_detection"],
    "type": ["info"]
  },
  "sonar": {
    "scenario_id": "baseline_scenario",
    "model_name": "baseline_model_20260204",
    "anomaly_score": 0.92,
    "threshold": 0.85,
    "window_start": "2026-02-04T11:55:00Z",
    "window_end": "2026-02-04T12:00:00Z"
  },
  "tags": ["sonar", "anomaly"]
}
Error handling
| Error Type | Strategy | Recovery |
|---|---|---|
| Connection failure | Retry with exponential backoff | Queue for later |
| Document rejection | Log invalid docs | Continue with valid docs |
| Bulk partial failure | Retry failed documents | Track success rate |
| Template missing | Auto-install templates | Retry operation |
Integration with pipeline
The shipper is invoked from pipeline.py after post-processing:
Anomaly Detection → Post-Processing → Shipper → Data Streams
Related documentation
- Data shipping guide:
docs/manual/sonar_docs/data-shipping-guide.md
Parent links: LARC-019 SONAR training pipeline sequence, LARC-020 SONAR detection pipeline sequence
25 SONAR debug mode design SWD-025
Local data provider (local_data_provider.py)
The debug mode enables offline testing and development without requiring a live Wazuh Indexer instance.
Interface compatibility
The LocalDataProvider implements the same interface as WazuhIndexerClient:
class DataProviderInterface:
    def fetch_alerts(
        self,
        start_time: datetime,
        end_time: datetime,
        filters: Optional[Dict] = None
    ) -> List[dict]:
        """Retrieve alerts for the specified time range."""
        pass
Data source configuration
Debug mode is configured in scenario YAML:
debug:
  enabled: true
  data_dir: "./sonar/test_data/synthetic_alerts"
  training_data_file: "normal_baseline.json"
  detection_data_file: "with_anomalies.json"
JSON data formats supported
The provider handles multiple JSON formats:
-
JSON array (preferred):
json [{"@timestamp": "...", "rule": {...}}, ...] -
Single object:
json {"@timestamp": "...", "rule": {...}} -
OpenSearch API response:
json
   {"hits": {"hits": [{"_source": {...}}, ...]}}
Time filtering
Local data provider applies the same time filtering as Wazuh client:
- Parse
@timestampfrom each alert - Filter alerts within
[start_time, end_time] - Return filtered list
Test data structure
Test data files in sonar/test_data/synthetic_alerts/:
| File | Alerts | Purpose | Anomalies |
|---|---|---|---|
normal_baseline.json |
12,000 | Training data | None |
with_anomalies.json |
6,000 | Detection testing | Yes (injected) |
Dependency injection pattern
The CLI selects the appropriate provider based on debug configuration:
if config.debug.enabled:
    provider = LocalDataProvider(config.debug)
else:
    provider = WazuhIndexerClient(config.wazuh)

# Both providers have identical interfaces
alerts = provider.fetch_alerts(start_time, end_time)
Benefits
- No infrastructure: Test without Wazuh deployment
- Reproducibility: Consistent test data across runs
- Speed: No network latency
- Isolation: Test feature changes independently
Related documentation
- Debug mode guide:
docs/manual/sonar_docs/setup-guide.md - Data injection:
docs/manual/sonar_docs/data-injection-guide.md
Parent links: LARC-019 SONAR training pipeline sequence, LARC-020 SONAR detection pipeline sequence