idps-escape
An example (with notebook)
In this section, we present an example illustrating the usage of ADBox, adopting the end user point of view.
My system
I have deployed all the components as explained in the guide for IDPS and SIEM integrated deployment and the ADBox user manual installation page. Moreover, I have enabled Linux resource monitoring.
My use-case
I want a detector which correlates resource usage and rules statistics. Once created, I want this detector to keep running on new data.
Therefore, I prepare a dedicated use-case file.
Namely,
-
I have to identify the features of the multivariate time-series that I want to perform detection on. To do so, I analyze the event logs of my system.
-
For every feature, I choose a suitable aggregation method for the granularity I wish to use.
-
For example, I would like a new point every 30 seconds (lowest advised granularity). Every point has 3 dimensions representing the average CPU percent usage, average memory percent usage and the total
firedtimesrule statistics parameter (essentially, count the number of alerts).
I have to decide:
- how I wish to handle missing values,
- the detector name,
- the data that is to be used to train my detector,
- the detection interval (window size), and
- the number of epochs for training.
For example, I want anomalies to be flagged over intervals of 3/5 minutes, so the window size should be 8. Then, I also want to use all my data of the current month that is already available to train the detector.
For the prediction, I want almost real-time results but I would like to fetch data in batches. For example, I want to get points every 6 minutes, then in batches of 12 points.
I encode this in siem_mtad_gat/assets/drivers/uc-9.yaml
training:
  aggregation: true
  aggregation_config:
    features:
      data.cpu_usage_%:
      - average
      data.memory_usage_%:
      - average
      rule.firedtimes:
      - count
    fill_na_method: Zero
    granularity: 30s
    padding_value: 0
  categorical_features: false
  columns:
  - data.cpu_usage_%
  - data.memory_usage_%
  - rule.firedtimes
  display_name: detector_example_3min
  index_date: '2024-08-*'
  train_config:
    epochs: 8
    window_size: 6

prediction:
    run_mode: BATCH
    batch_size: 12
Running the pipeline
I run adbox
./adbox.sh -u 9
and stop it after a few hours.
This produces a detector with id 2d36a80a-c47a-4eb4-bb3e-5b2bfb90dc9 and the associated folder siem_mtad_gat/assets/detector_models/2d36a80a-c47a-4eb4-bb3e-5b2bfb90dc9.
2d36a80a-c47a-4eb4-bb3e-5b2bfb90dc9
├── input
│   ├── detector_input_parameters.json
│   └── training_config.json
├── prediction
│   ├── uc-9_predicted_anomalies_data-1_2024-08-30_10-24-15.json
│   └── uc-9_predicted_data-1_2024-08-30_10-24-15.json
└── training
    ├── losses_train_data.json
    ├── model.pt
    ├── scaler.pkl
    ├── spot
    │   ├── spot_feature-0.pkl
    │   ├── spot_feature-1.pkl
    │   ├── spot_feature-2.pkl
    │   └── spot_feature-global.pkl
    ├── test_output.pkl
    ├── train_losses.png
    ├── train_output.pkl
    └── validation_losses.png

4 directories, 15 files
Detection analysis
Using the ADBox Result Visualizer Notebook, I can plot the results and analyze them. Here, I collect a few observations.
Training
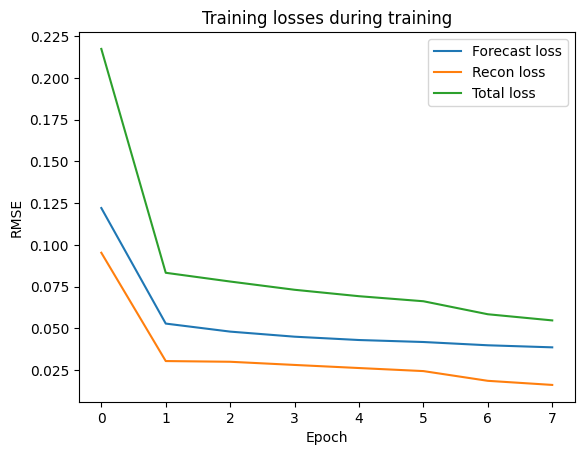
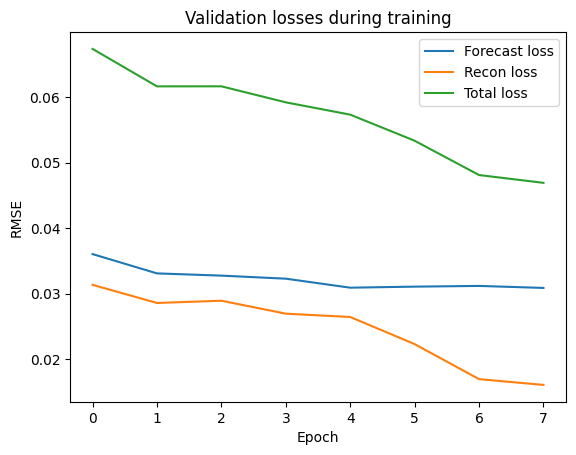
The training losses are rather good for 8 epochs, while the same cannot be said about the validation losses. I could try the same setting, while training the detector for more epochs.


Prediction
I ran the batch prediction from2024-08-30T10:18:04Z to 2024-08-30T13:05:30Z UTC time.
Global overview

During this time period, 5 anomalous windows were flagged, 4 consecutive and 1 alone. Let’s call them A1 and A2, respectively.


Feature overview
Looking at the feature statistics, we can see these two anomalies expressing two different cases:
- anomalies in A1 can be also considered anomalies at the feature level.
- the anomaly in A2 is anomalous only at a global level.


Wazuh Dashboard
Looking at the Wazuh Dashboard, we can observe a high number of events in proximity of A1:


Mapping anomalies to real events
We traced the two anomalies to two real events that had happened in the corresponding detections intervals:
- A1 matches with the running of
apt updateandapt upgradeon the host machine. - A2 matches with a reboot.
Remarks
In both cases, the actions that (most probably) generated the anomalies had been carried out by a system administrator. In case not, while A1 would have been noticed by looking at single features and/or Wazuh; A2 would have not been as obvious to track.